
|
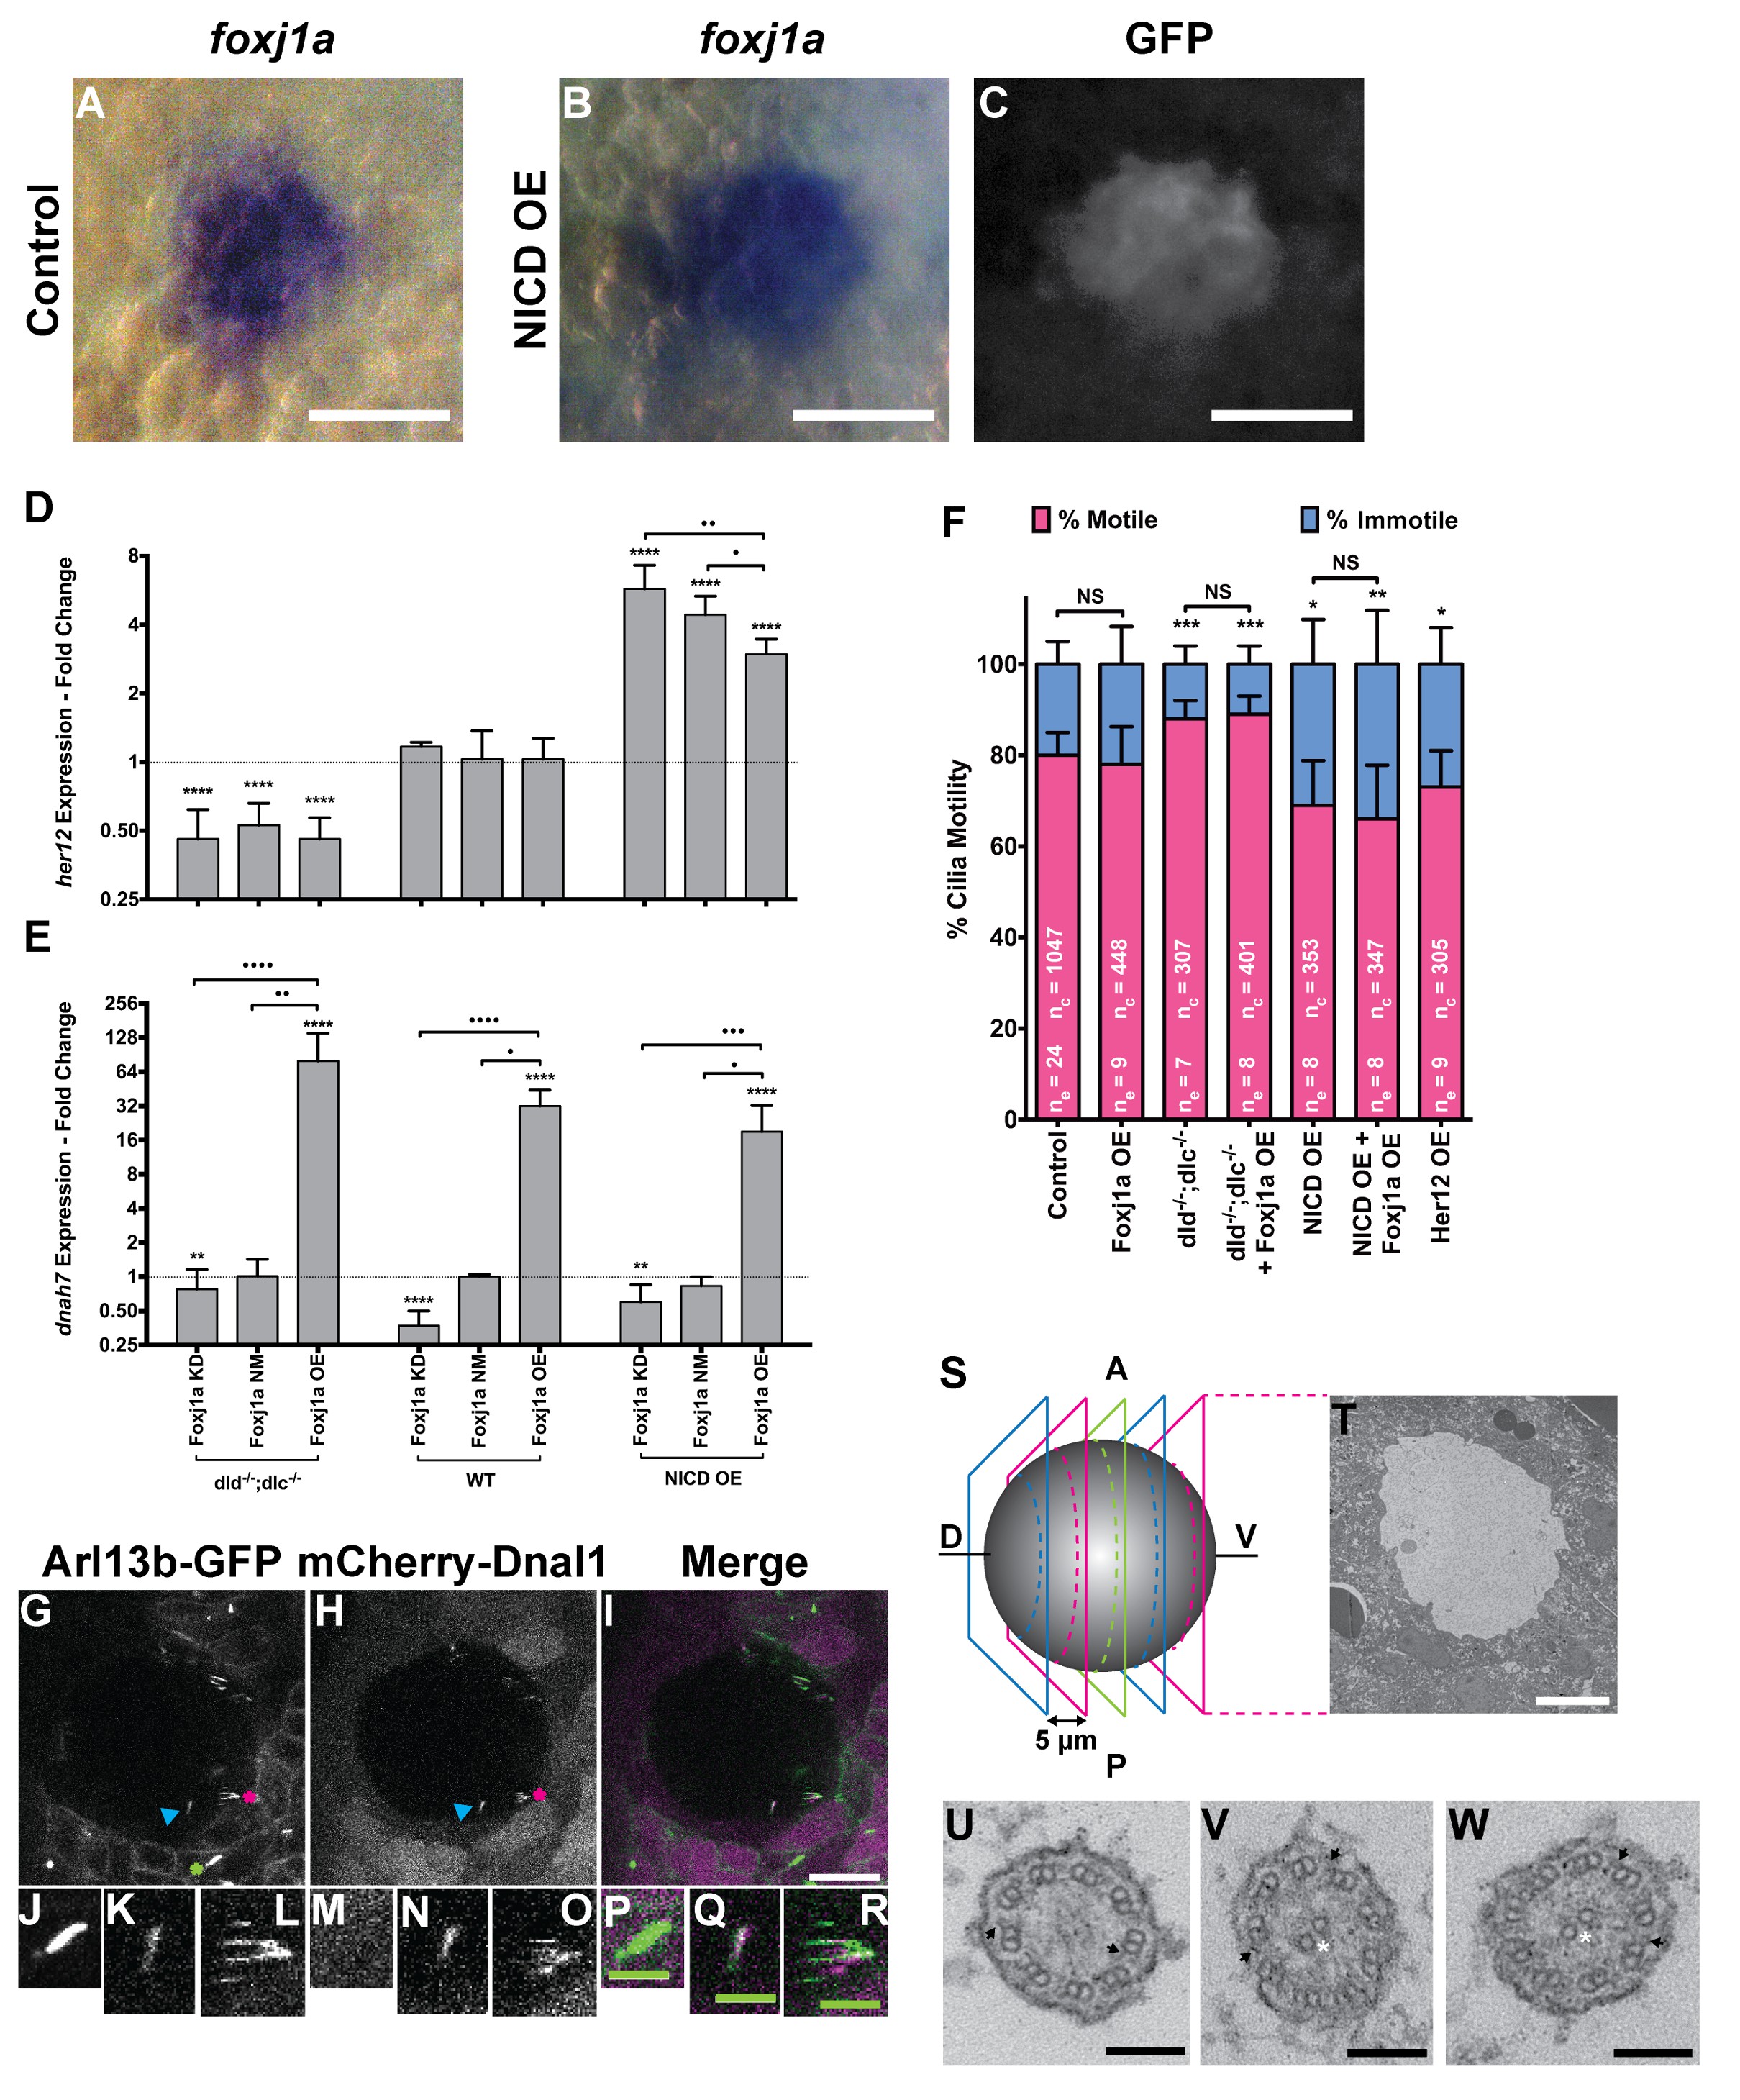
Fig. 4
foxj1a is expressed in dorsal forerunner cells structurally specifying all cilia as motile cilia.
(A-C) In situ hybridization with foxj1a at bud stage in the dorsal forerunner cells (DFCs), in a control representative embryo (A) and upon NICD overexpression (B). (C) Performing immune-staining with an antibody anti-GFP in the same embryos revealed co-localization with sox17:GFP, a marker for DFCs at bud stage. (D–E) Fold change (log2) in expression levels of her12 (D), and dnah7 (E) in whole embryos with different Notch Signalling and Foxj1a manipulations at bud stage. dld−/−;dlc−/− – deltaD and deltaC double mutant; WT – Wild Type, non-injected controls; NICD OE – overexpression of Notch Intracellular Domain by injecting NICD mRNA; Foxj1a KD – knock-down of Foxj1a by Morpholino injection; Foxj1a NM – Foxj1a non-manipulation; and Foxj1a OE – overexpression of Foxj1a by injecting foxj1a mRNA. Statistical significance tested with Mann-Whitney U-test (**p<0.01 and ****p<0.0001). Kruscal-Wallis one-way analysis of variance with Dunn’s correction for multiple comparisons was used to determine significant differences between different Foxj1a treatments in the same NS assay (*p<0.05, **p<0.01, ***p<0.001, and ****p<0.0001). (F) Changes in the % of Immotile and Motile Cilia after manipulation of NS and/or of Foxj1a levels, and imaged by Multiphoton fluorescence microscopy at 0.16 frames per second. Unpaired Welch t-test (Control vs Foxj1a OE; Control vs Her12 OE) and one-way ANOVA with Bonferroni’s correction for multiple comparisons (Control vs NICD OE vs NICD OE +Foxj1 a OE; Control vs dld−/−;dlc−/− vs dld−/−;dlc−/− + Foxj1 a OE). *p<0.05; **p<0.01; ***p<0.001. NS stands for non significant. (G–I) Live KV from Arl13b-GFP Tg zebrafish embryo at 8 ss, over-expressing mCherry-Dnal1 (M–O). Of note are the positive GFP and mCherry signals present in both Immotile (K, N, Q) and Motile KV cilia (L, O, R). Primary cilium showed no mCherry signal (J, M, P). In the sample of cilia positive for dnal1-mCherry, we scored 72% motile cilia and 28% immotile cilia (n = 56 cilia in a total of 4 embryos). Scale bars represent 20 μm (white) and 5 μm (green). Blue arrow – immotile cilia; magenta asterisk – motile cilia; green asterisk – primary cilia. Ss -somite stage. (S–W) Transmission electron microscopy (TEM) micrographs of the kupffer’s vesicle from 10 ss wild type zebrafish embryos. (S) Schematics of the sampling methodology sectioning every 5–7 microns to recover full transverse sections such as the one shown in (T). (U-W) Examples of the two types of cilia ultrastructure observed, (U) without visible central pair but showing visible outer and inner dynein arms (arrows) or with visible central pair and dynein arms (U, V).