
Image
|
Figure Caption
Fig. 3
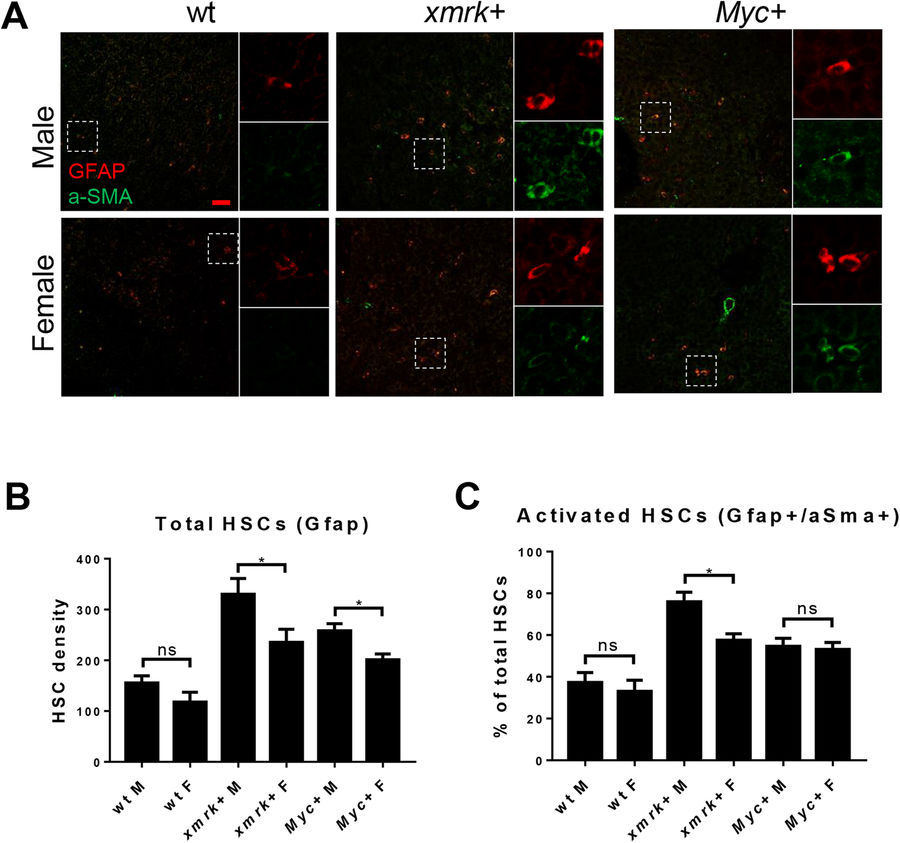
Determination of HSCs and activated HSCs in the livers of male and female xmrk+ and Myc+ fish following oncogene activation. 10 fish were analyzed in each group and the experiment was repeated once for reproducibility. (A) IF co-staining of GFAP (red) and a-SMA (green) in liver sections. White boxes indicate the enlarged area as shown on the right. (B) Quantification of total HSC density in liver sections. (C) Quantification of activated ratio of HSCs in liver sections. *P < 0.05. Scale bars: 20 μm.
Acknowledgments
This image is the copyrighted work of the attributed author or publisher, and
ZFIN has permission only to display this image to its users.
Additional permissions should be obtained from the applicable author or publisher of the image.
Full text @ Sci. Rep.