
|
Fig. S3
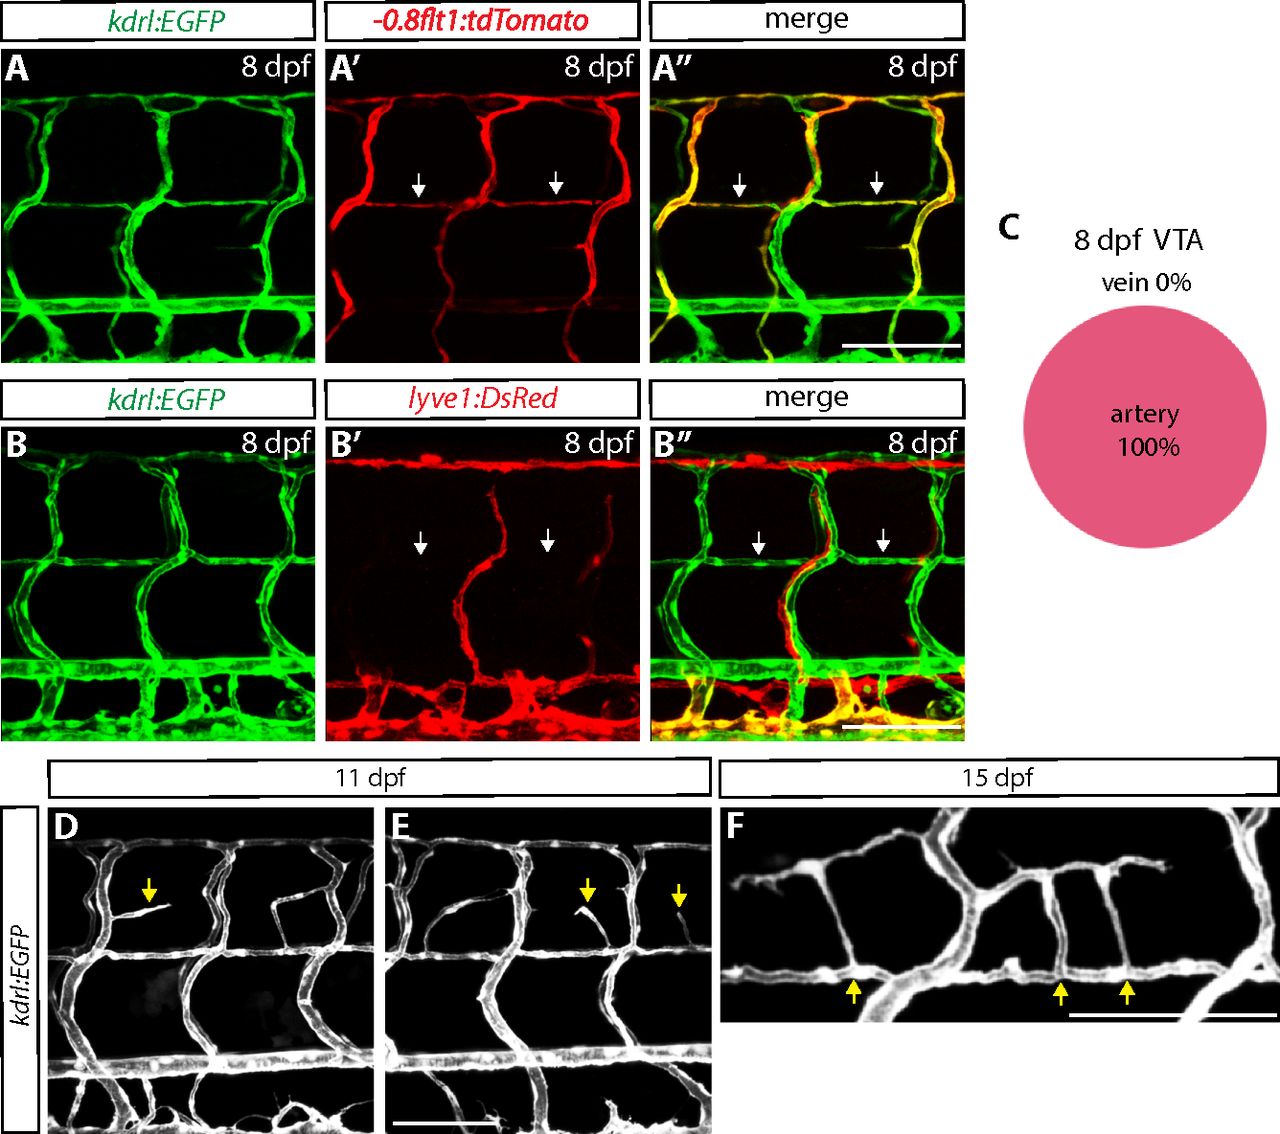
Characterization of VTAs and the PNVP. (A–A″) 8 dpf Tg(kdrl:EGFP);Tg(-0.8flt1:tdTomato) trunk vasculature. Vessels that exhibit strong Tg(-0.8flt1:tdTomato) expression comprise those of arterial identity, and VTAs also show strong Tg(-0.8flt1:tdTomato) expression (white arrows). (B–B″) 8 dpf Tg(kdrl:EGFP);Tg(lyve1:DsRed) trunk vasculature. Vessels that show Tg(lyve1:DsRed) expression comprise those of venous and lymphatic identity, and VTAs are not positive for Tg(lyve1:DsRed) expression (white arrows). (C) Percentage of VTAs that show strong Tg(-0.8flt1:tdTomato) expression at 8 dpf (132 VTAs quantified in 12 fish). All of the VTAs examined at 8 dpf show strong Tg(-0.8flt1:tdTomato) expression. (D and E) 11 dpf Tg(kdrl:EGFP) larval trunk vasculature. Sprouting vessels in the dorsal trunk emerge from ISVs or VTAs (yellow arrows). (F) High-magnification image of Tg(kdrl:EGFP) trunk vasculature at 15 dpf. Vessels that emerge around the spinal cord are connected to the VTAs (yellow arrows). (Scale bar, 100 µm.)