
Image
|
Figure Caption
Fig. S5
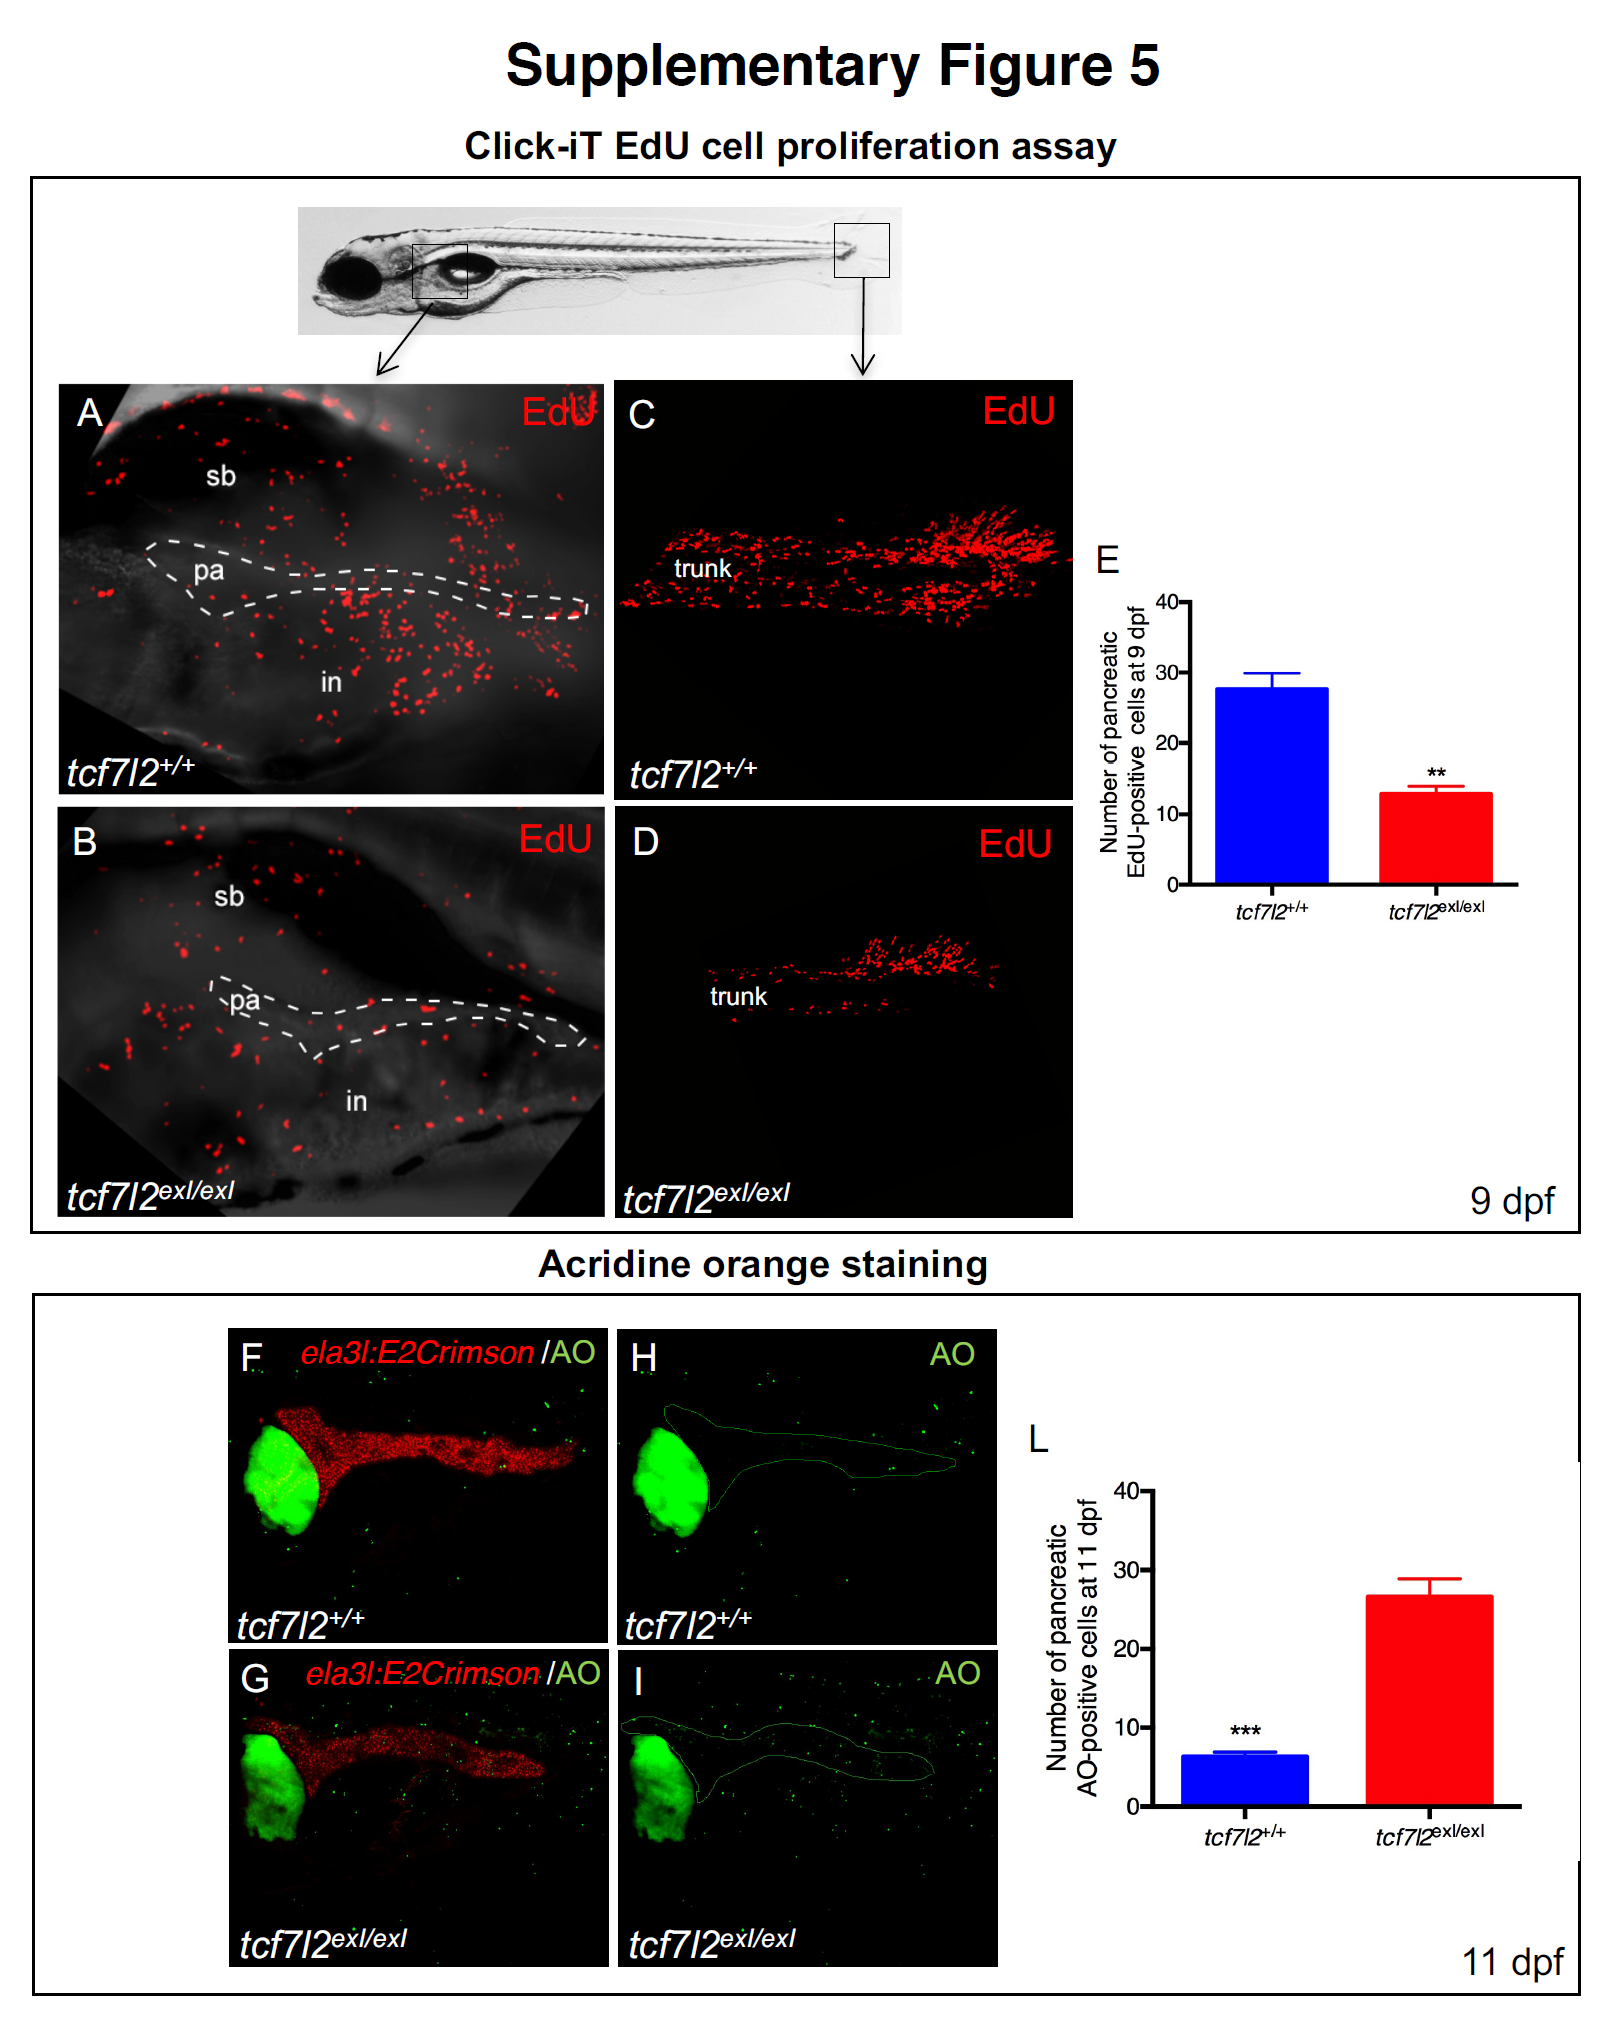
Decreased proliferation and increased cell death in tcf7l2exI/exI. 2D projections of confocal Z-series images of wild type (A) and tcf7l2exI/exI (B) at 9 dpf, showing EdU-positive cells (red) in the pancreatic region (dashed area). C, D: examples of caudal fins of wt and tcf7l2exI/exl mutant analysed by Click-iT EdU cell proliferation assay. Red signals indicate proliferating cells. F-I: Acridine Orange (AO, green dots). E,L: Quantification of EdU (E) and AO (L); n=6 for both charts. sb=swim bladder; pa=pancreas; in=intestine.
Acknowledgments
This image is the copyrighted work of the attributed author or publisher, and
ZFIN has permission only to display this image to its users.
Additional permissions should be obtained from the applicable author or publisher of the image.
Full text @ Sci. Rep.