
|
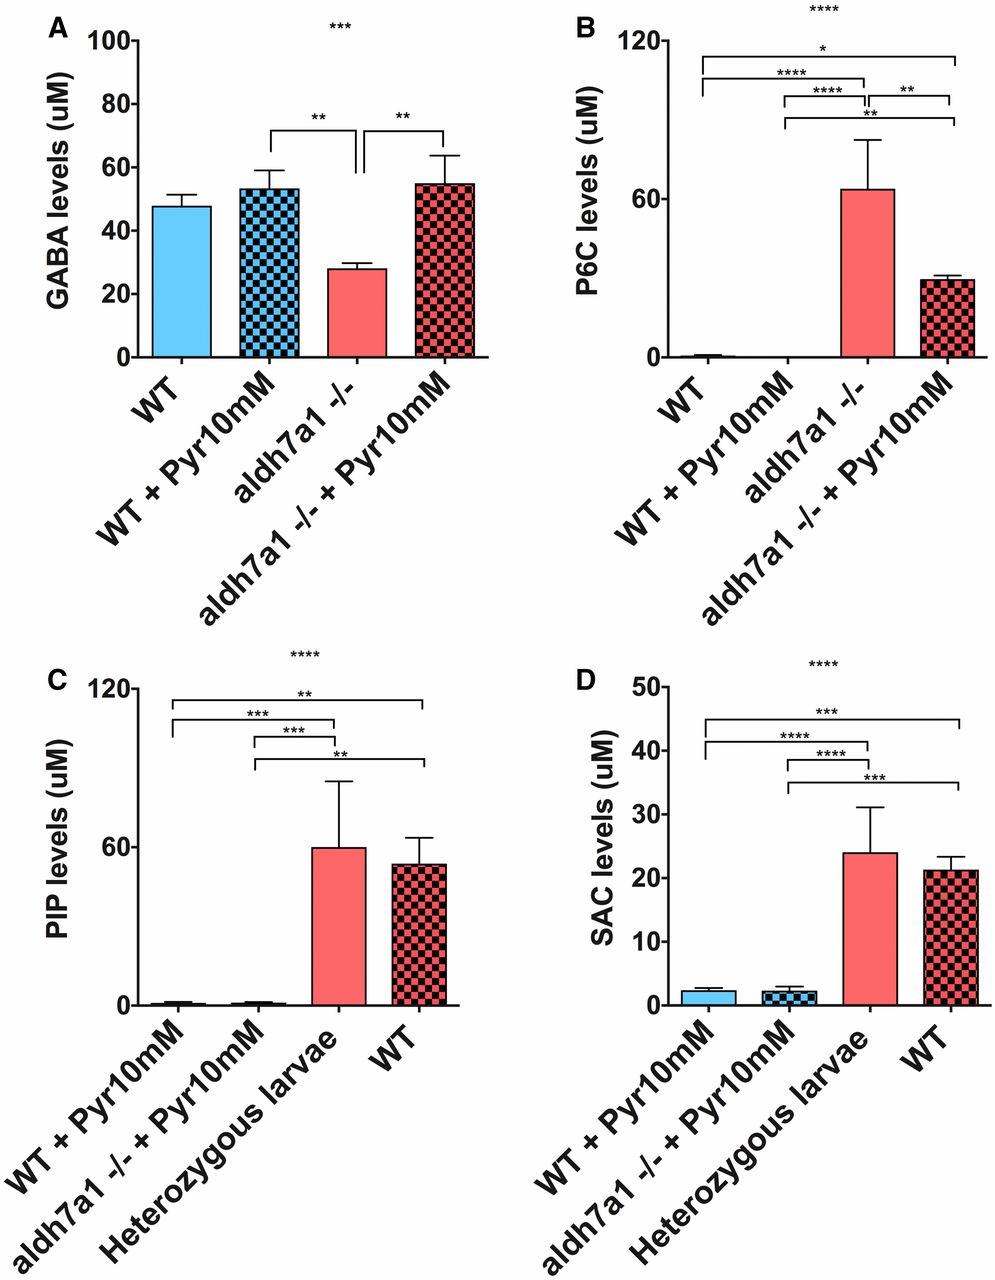
Fig. 8 GABA levels are normalized by Pyr treatment but lysine metabolites are mostly unaffected in aldh7a1−/− larvae. Mass spectrometry analysis of lysine metabolites in polar metabolite extracts was obtained from three pools of 11-days postfertilization larvae (six individuals each pool) per experimental condition; GABA (A), P6C (B), SAC (C), and PIP (D). Asterisks indicate statistical significance according to one-way ANOVA Tukey’s post hoc tests (* P < 0.05, ** P < 0.01, *** P < 0.001, **** P < 0.0001). Error bars represent ± SD. GABA, γ-aminobutyric acid; P6C, piperideine-6-carboxylate; PIP, pipecolic acid; Pyr, pyridoxine; SAC, saccharopine; WT, wild-type.