
|
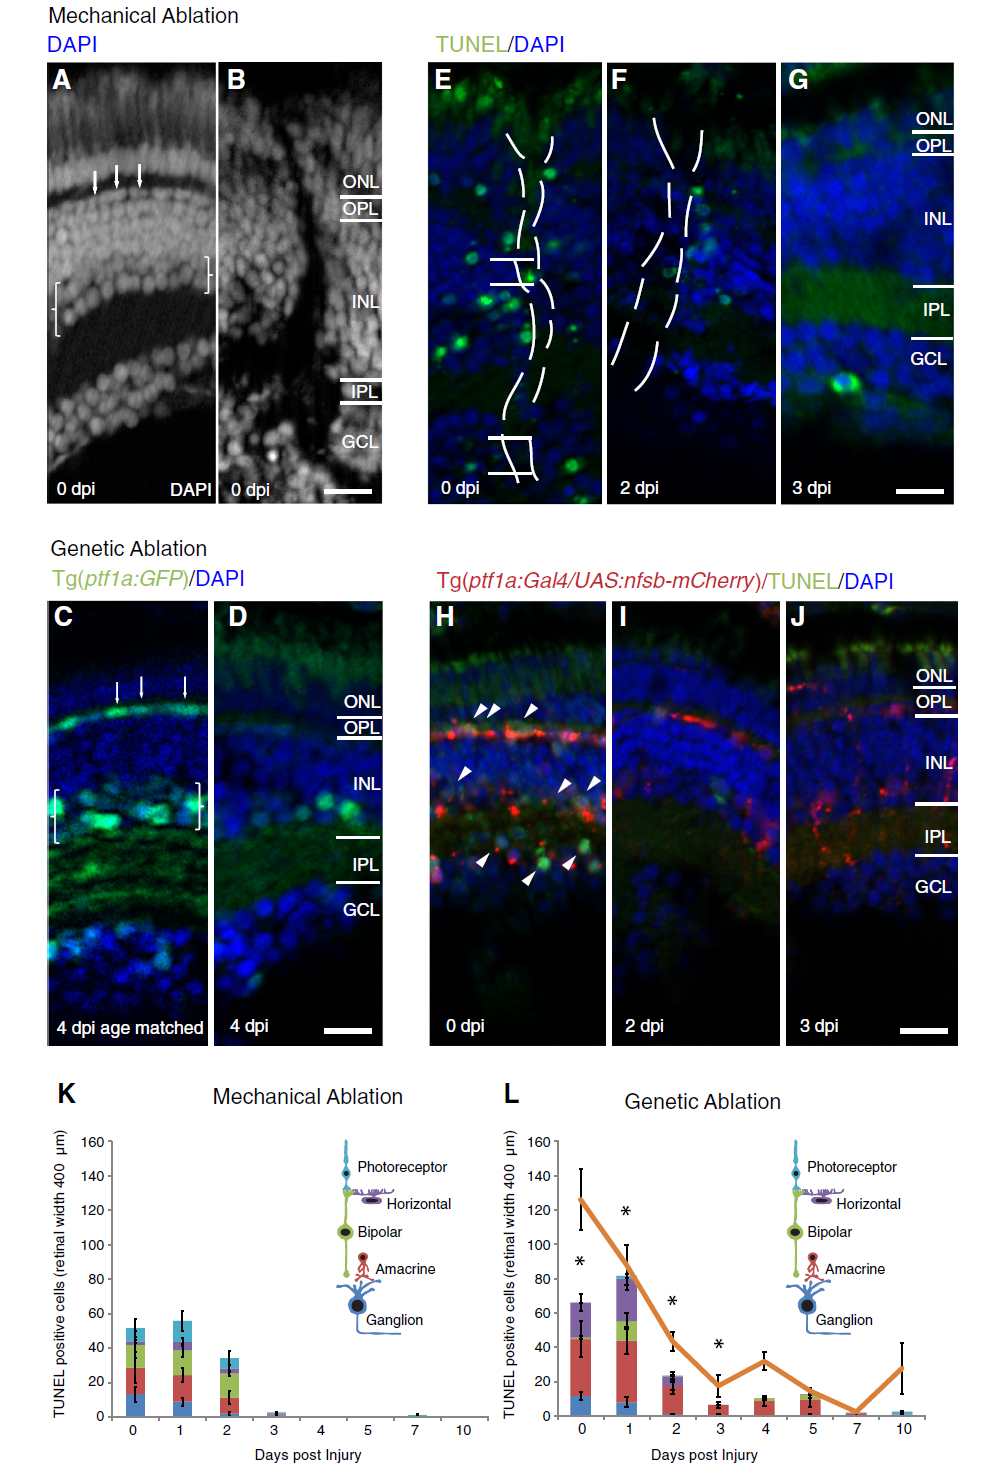
Fig. 1
Neuron type specific cell death and comparable regenerative time course in two distinct injury models. a-j Micrographs of retinal sections after mechanical (a, b, e-g) or metronidazole induced genetic ablation in Tg(ptf1a:Gal4 / UAS:nfsb-mCherry) (c, d, h-j, a, c) Retinal architecture of the uninjured retina at equivalent ages (b, d). Brackets indicate the amacrine neuron layer (weaker DAPI staining in the inner half of the INL) and arrows indicate the horizontal neuron layer (first row of flattened nuclei in the inner nuclear layer – INL). b, d Retinal architecture of injured retina revealed by DAPI staining shows disruption caused by the needle track immediately after ablation injury (0 dpi), affecting neurons types in each retinal layer (b), and loss of horizontal cells and amacrine cells (seen by the reduction in Ptf1a:GFP transgene expression, which specifically labels these two cell types) 4 days after injury, which is a timepoint following the main cell death phase (d). e-j TUNEL labelling at different days post-injury (dpi) in both injury models. TUNEL staining is observed in all retinal layers early after mechanical ablation (e-g) and more biased towards horizontal and amacrine cells (arrowheads in INL and displaced amacrine cells in GCL) layers among nitroreductase expressing (red) cells (h-j). k, l Quantification of TUNEL positive cells in the different retinal layers across days post-injury reveals a peak in cell death in the first two days distributed across all retinal layers in the mechanical ablation (k) and primarily confined to inhibitory neurons after genetic ablation (l) (n = 12 larvae per timepoint). Asterisks indicate timepoints at which TUNEL labelling was in a significantly higher proportion of inhibitory neurons in the genetic versus mechanical ablation (p-value <0.038). l Loss of nitroreductase-mCherry positive cells follows the cell death observed in genetic ablation (orange line, n = 12 larvae per timepoint). Results are mean ± SEM. ONL: outer nuclear layer; OPL: outer plexiform layer; IPL: inner plexiform layer; GCL: ganglion cell layer; nfsb: Nitroreductase. Scale bar in D (for a-d) = 50 μm, scale bar in J (for e-j) = 50 μm