
|
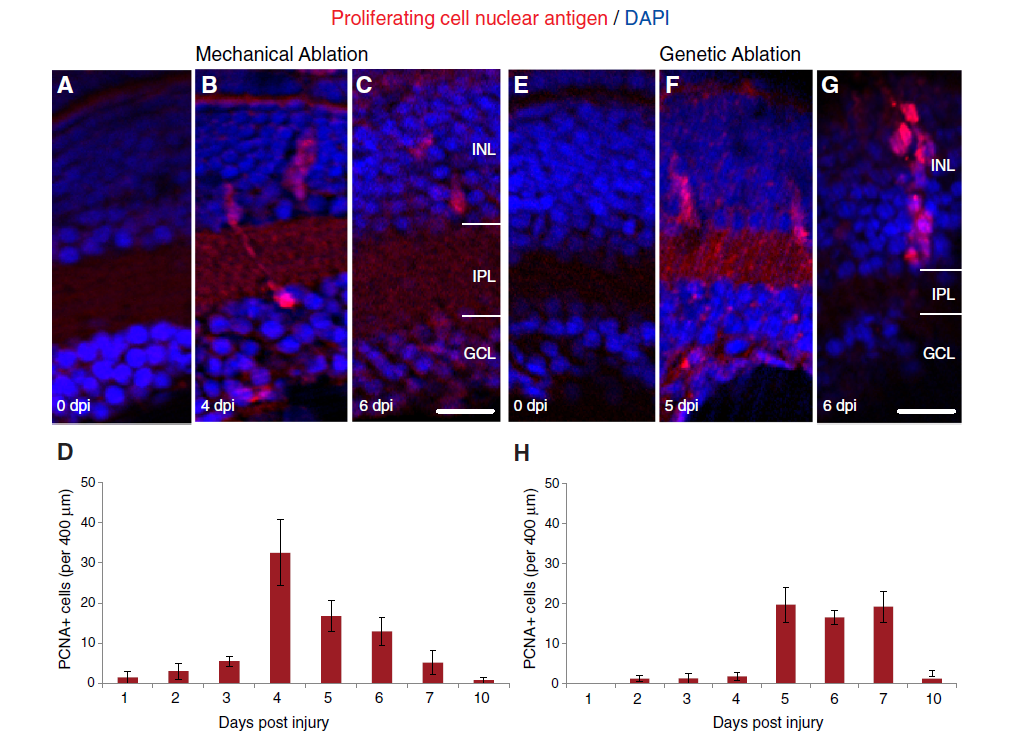
Fig. 2
Timing of PCNA labelled proliferation is comparable between injury models. a-c, e-g) Micrographs of retinal sections after mechanical injury (a-c) and genetic ablation injury (e-g). Retinal sections stained for PCNA (proliferating cell nuclear antigen, red) show cell clusters that span across multiple retinal layers in both injury models (b, f, g). d, h The graph shows the total number of PCNA cells after mechanical (d) and genetic ablation injury (h) model, suggesting that broadly, proliferation does not begin until 3–4 dpi and is active for at least three days (n = 12 larvae per timepoint per injury model). Results are mean ± SEM. INL: inner nuclear layer; IPL: inner plexiform layer; GCL: ganglion cell layer. Scale bar in G (for a–c, e-g) = 50 μm