
Image
|
Figure Caption
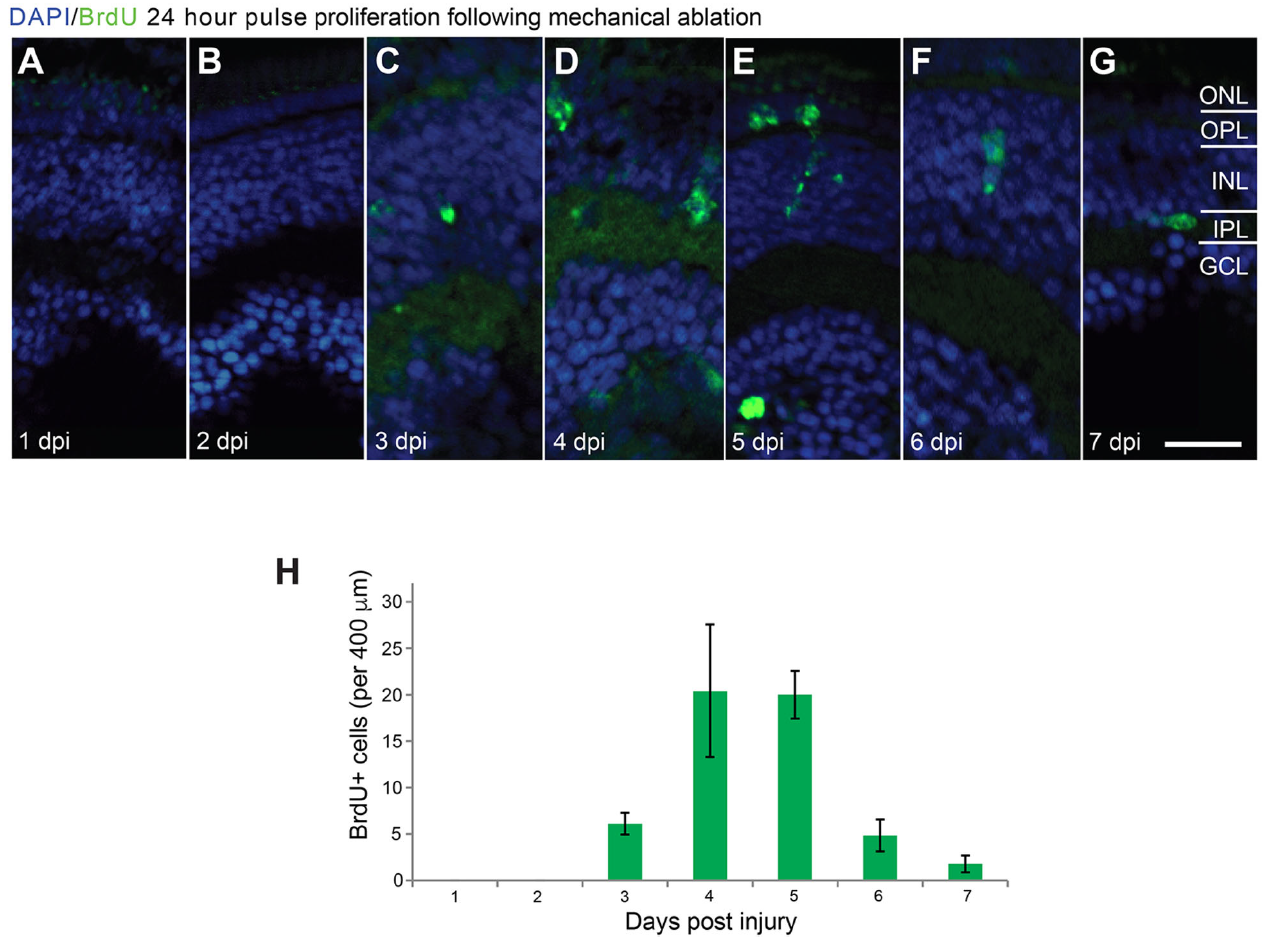
Fig. 4
Proliferation time course measured with 24 h pulse BrdU incorporation is comparable to PCNA time course. a-g) Micrographs of retinal sections after mechanical injury stained with DAPI (blue) and for BrdU (green). a-g) BrdU positive cell clusters were observed between 3 to 7 days post-injury (dpi) with cells across multiple retinal layers. h The graph shows that BrdU positive cells were most abundant within a 2–3 day time period (n = 12 larvae). Results are mean ± SEM. Scale bar G (for a-g) = 50 μm
Acknowledgments
This image is the copyrighted work of the attributed author or publisher, and
ZFIN has permission only to display this image to its users.
Additional permissions should be obtained from the applicable author or publisher of the image.
Full text @ Neural Dev.