
|
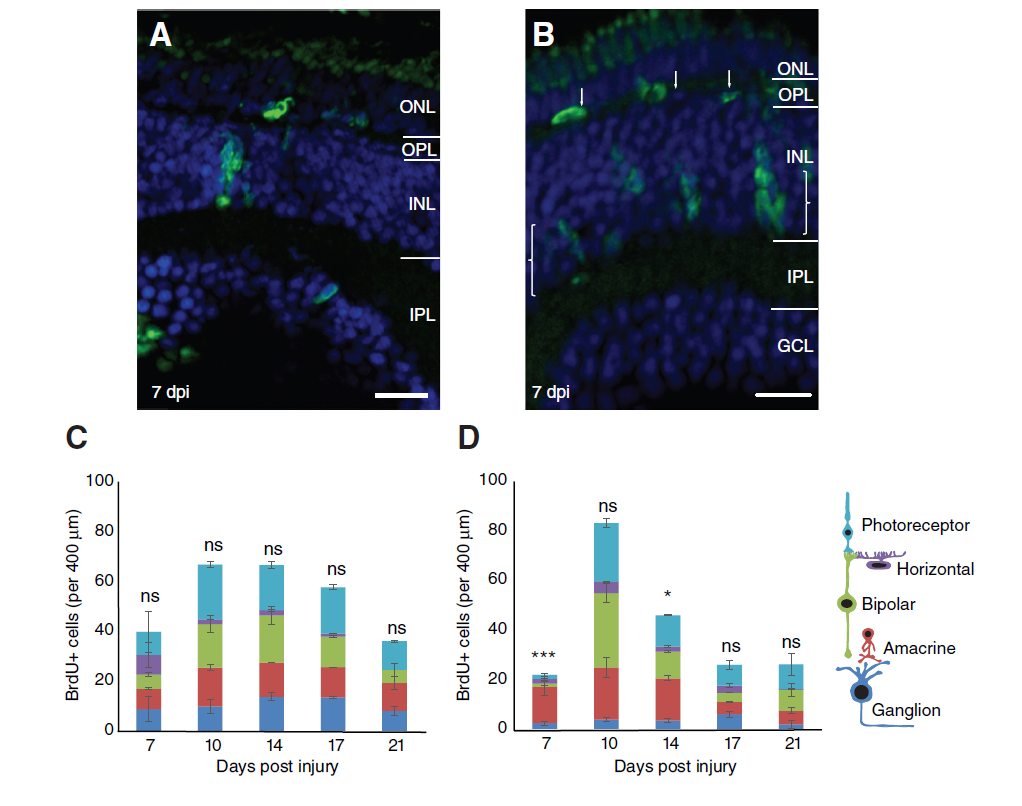
Fig. 5
Prolonged BrdU exposure reveals cell type specific replacement. a, b Micrographs of mechanical and genetic ablated juveniles in prolonged BrdU exposure between 3 and 7 dpi. Retinal lamination has recovered by this timepoint with horizontal cells (arrows) and amacrine cell layer (brackets) re-establishing after genetic ablation. c, d Graphs indicating the total number of BrdU cells in each retinal layer across 5 time points observed in the mechanical (c) and genetic (d) ablation injury models. Statistics indicate comparison of the proportion of inhibitory neurons compared to age-matched uninjured control composition. After genetic ablation the vast majority of proliferative cells at 7 dpi are confined to the inhibitory layers, most notably the amacrine layer (*** p-value = 2.2 × 10⁻⁷ compared to WT proportion). In both injuries, the total number of cells per layer increases after 7 dpi and decreases by 14 dpi (genetic) and 17 dpi (mechanical) (n = 12 larvae at 7 and 10 dpi, 8 larvae at 14 dpi and 6 larvae at 17 and 21 dpi). Ns: not significant (p-value >0.05), * p-value = 0.004. Results are mean ± SEM. ONL: outer nuclear layer; OPL: outer plexiform layer; INL: inner nuclear layer; IPL: inner plexiform layer; GCL: ganglion cell layer; Scale bars = 50 μm