
|
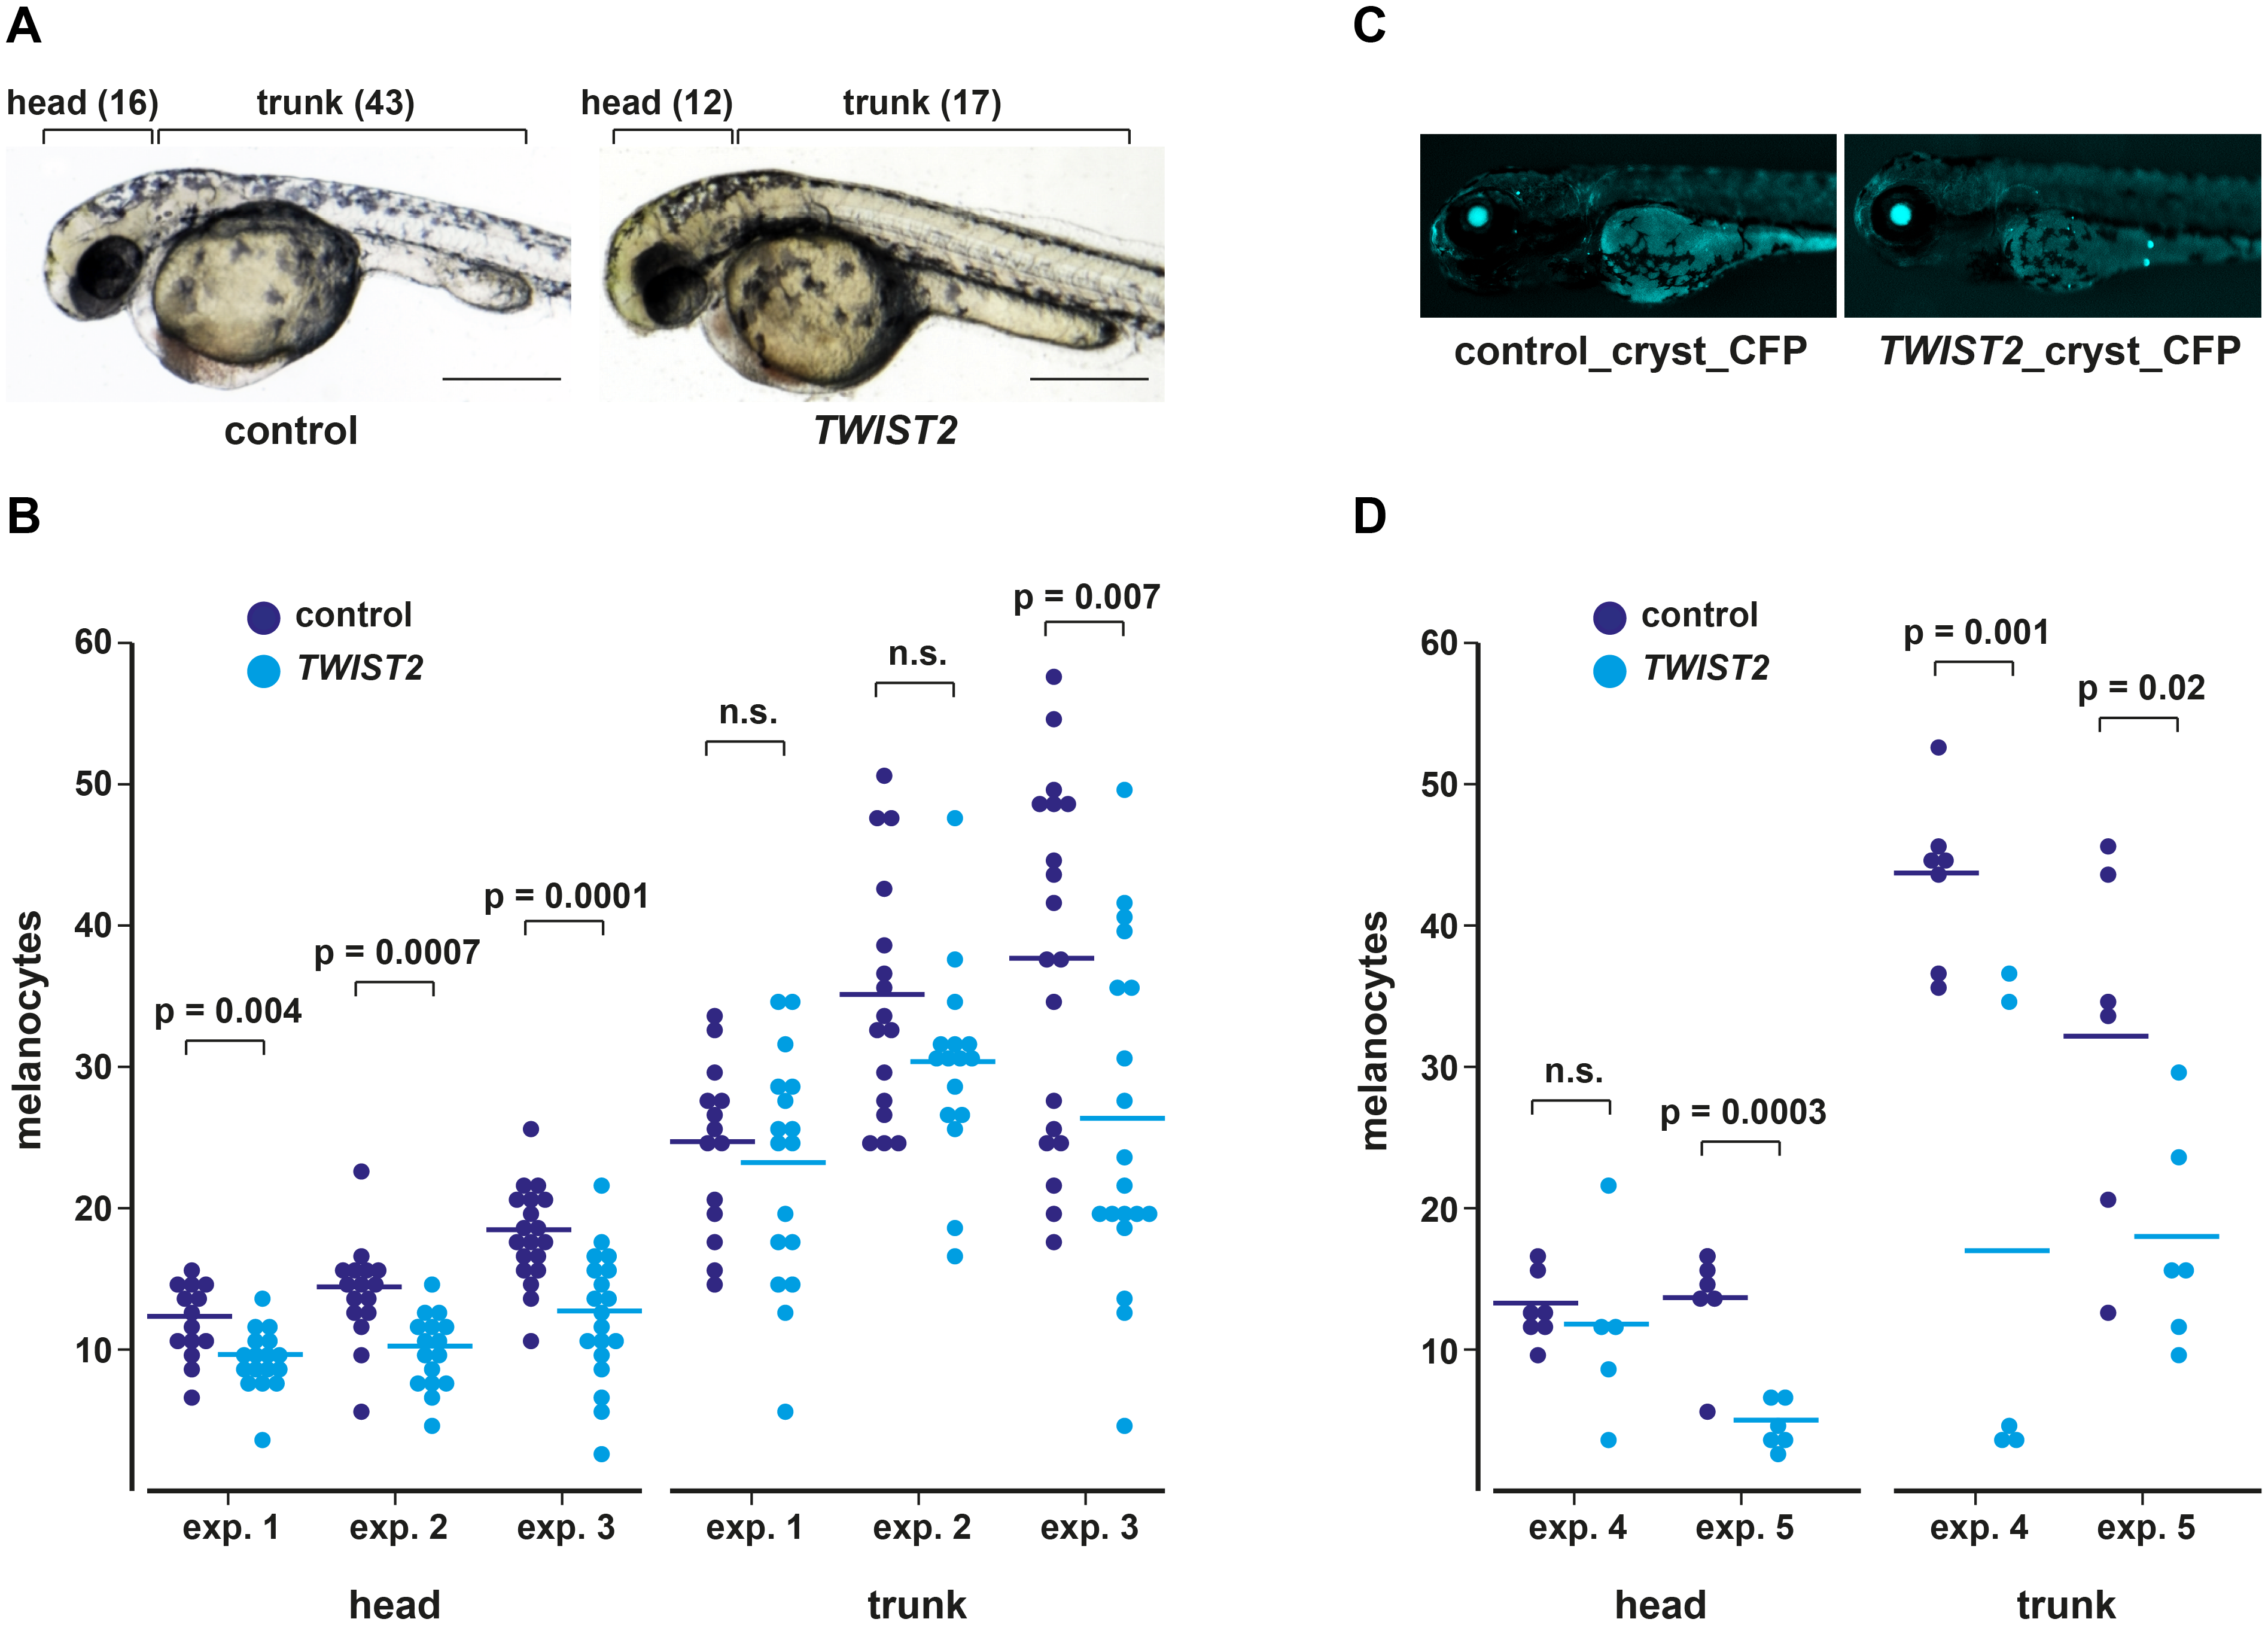
Fig. 4
Reduction of melanocytes in zebrafish embryos expressing bovine TWIST2 at 35 hpf.
(A) Representative images of zebrafish embryos injected with either a control construct (pmitfa_EGFP) or a construct driving the expression of bovine TWIST2 under control of the zebrafish mitfa promoter (pmitfa_btaTWIST2_EGFP). Melanocyte counts for head and trunk are given in brackets. Scale bars correspond to 1 mm. (B) Melanocytes in the head and trunk were counted in three experiments (controls: n = 14, 16, 19; TWIST2: n = 17, 16, 19). (C) The experiments were repeated with another set of constructs that additionally had CFP as a reporter for transgenesis. In transgenic animals, cerulean fluorescence in the eyes becomes visible at ~4–5 dpf. (D) Melanocyte counts in two replicate experiments at 35 hpf from zebrafish injected with the constructs pmitfa_EGFP_cryst_CFP and pmitfa_TWIST2_EGFP_cryst_CFP. If (B) and (D) are taken together the TWIST2 overexpressing embryos had significantly fewer melanocytes in the head in 4 out of 5 experiments and in the trunk in 3 out of 5 experiments.