
|
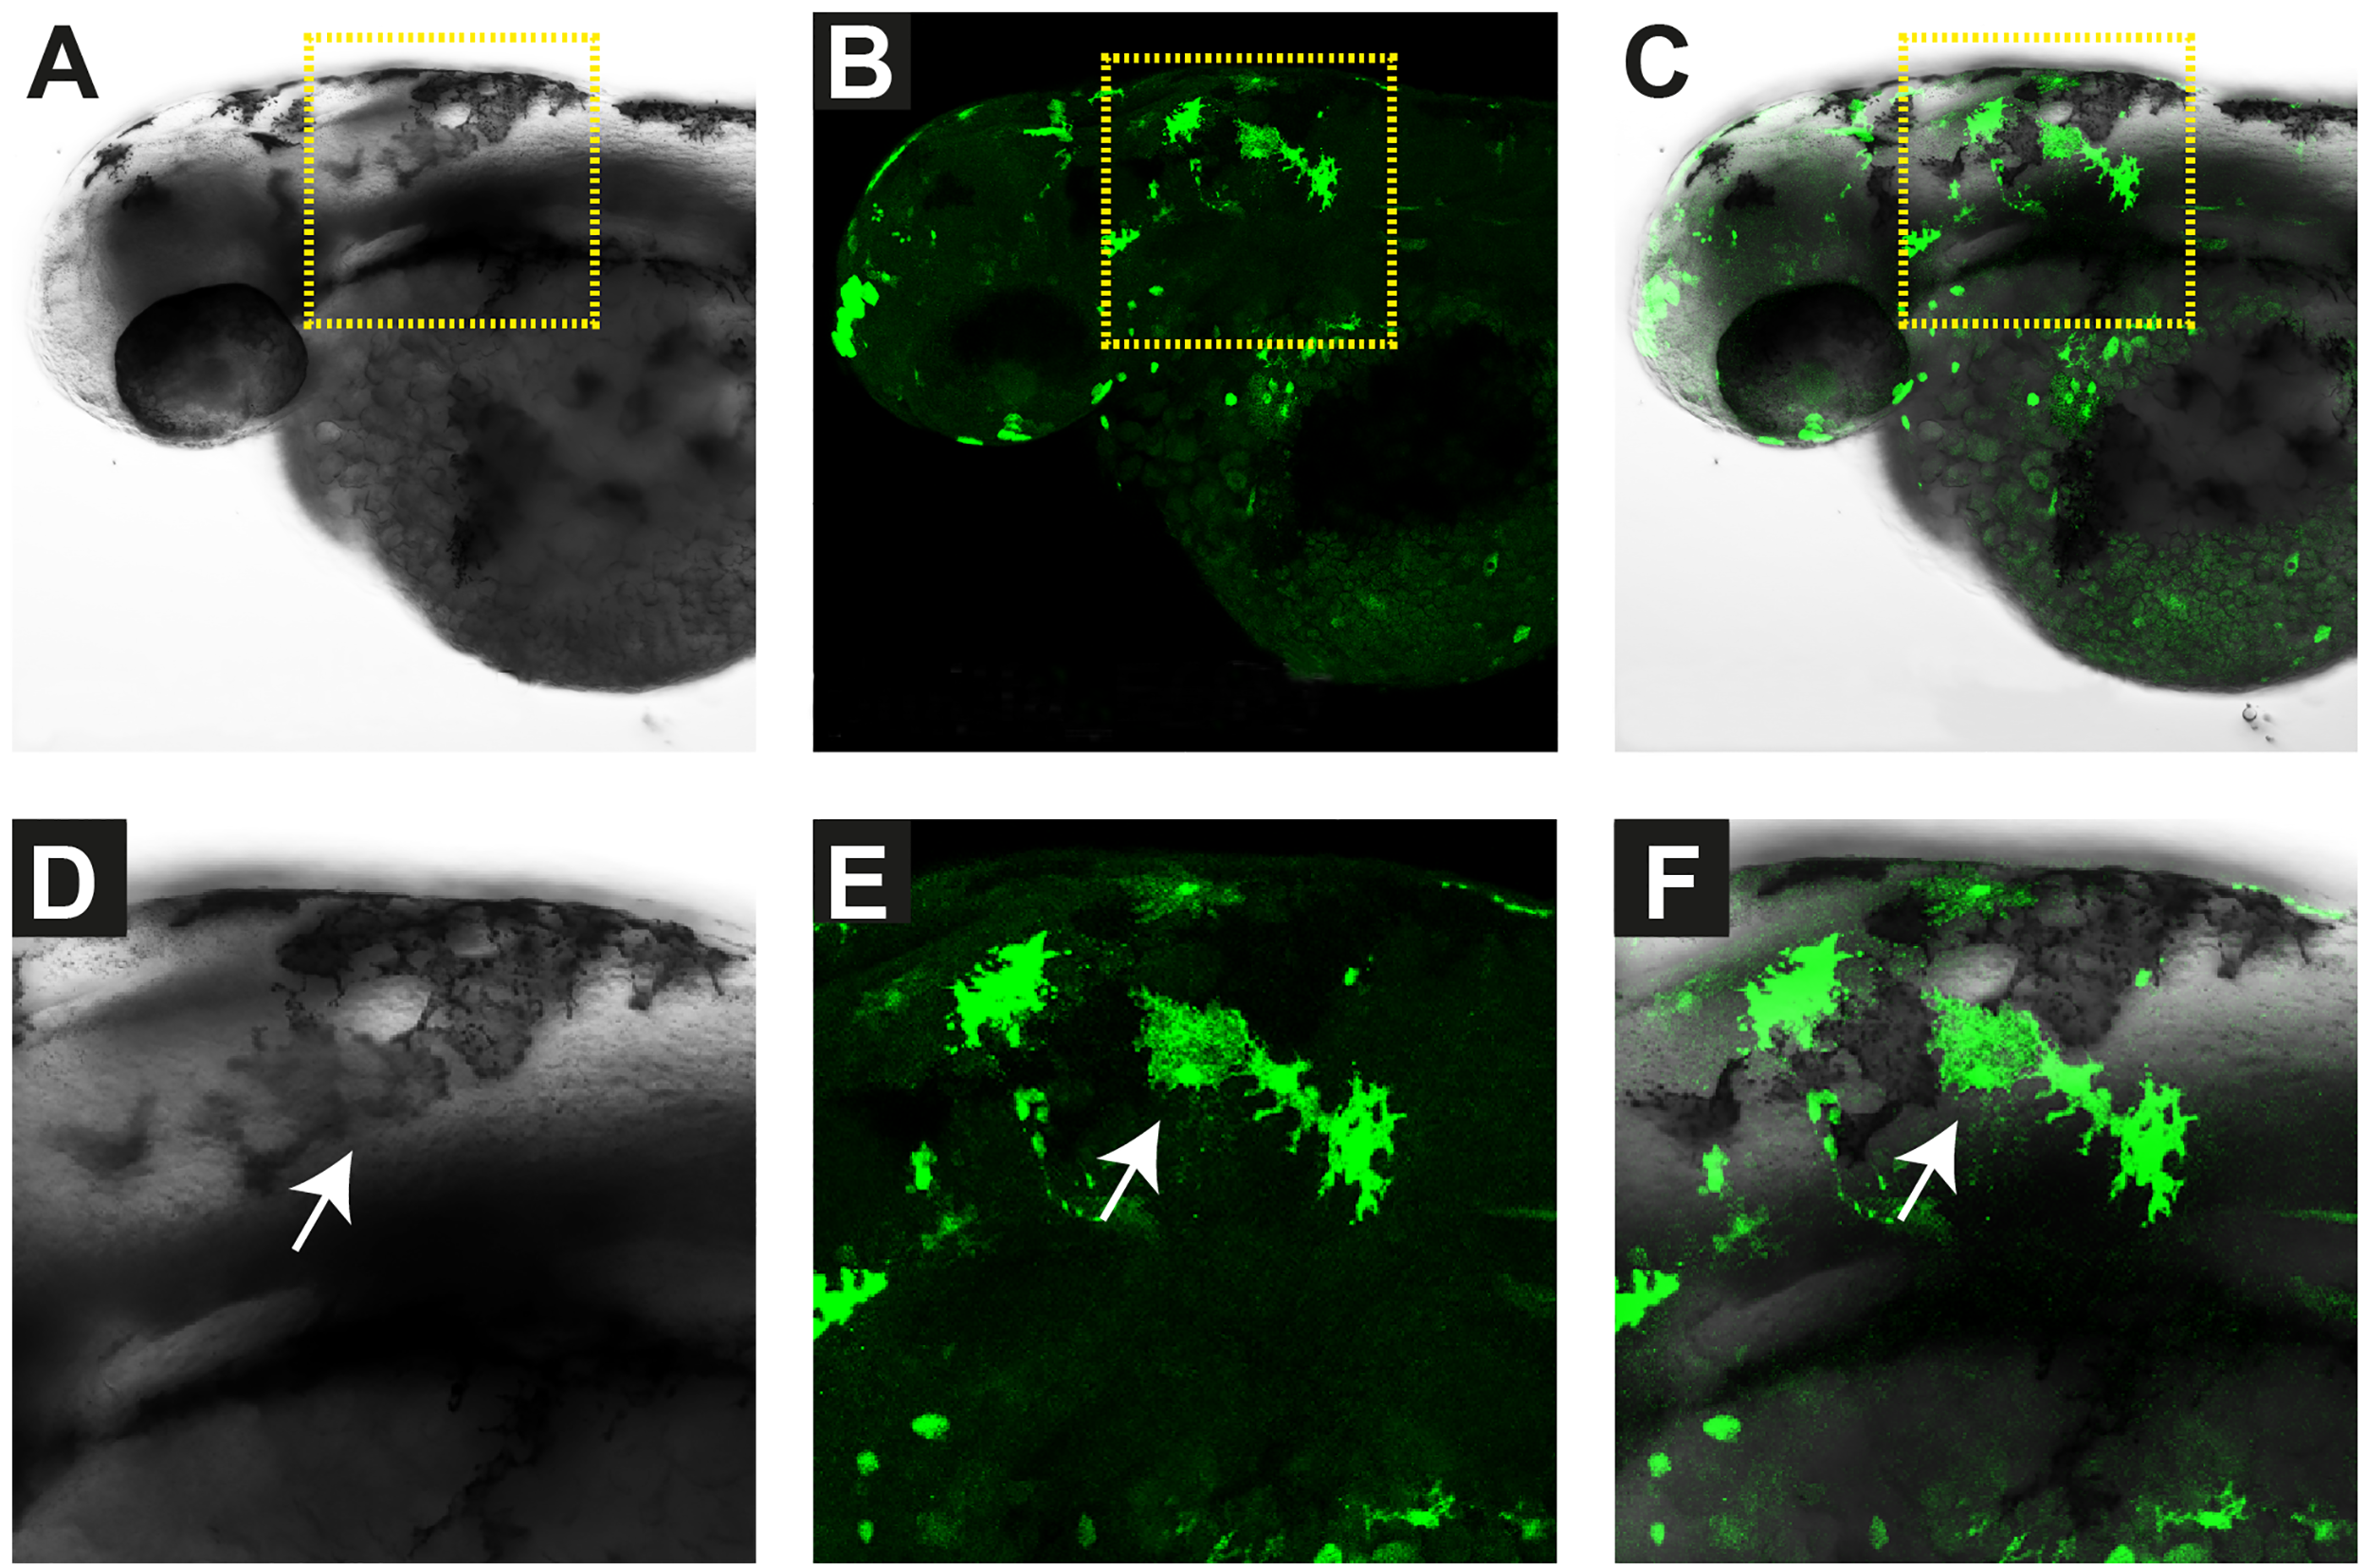
Fig. 3
Verification of EGFP expression in melanocytes.
In all panels, representative images of the same zebrafish embryo at 35 hours post fertilization (hpf) are shown. This embryo had been injected with the control construct pmitfa_EGFP, which drives expression of green fluorescent protein under the control of the zebrafish mitfa promoter. (A) The brightfield image shows individual darkly pigmented melanocytes. (B) EGFP expression was confirmed by antibody staining with an anti-EGFP antibody resulting in green fluorescence. (C) Superimposition of the brightfield image showing melanocytes with the corresponding fluorescent image showing EGFP positive cells. (D-F) Magnifications of the areas indicated by the dashed yellow square. An individual EGFP-positive melanocyte is indicated by arrows.