
Image
|
Figure Caption
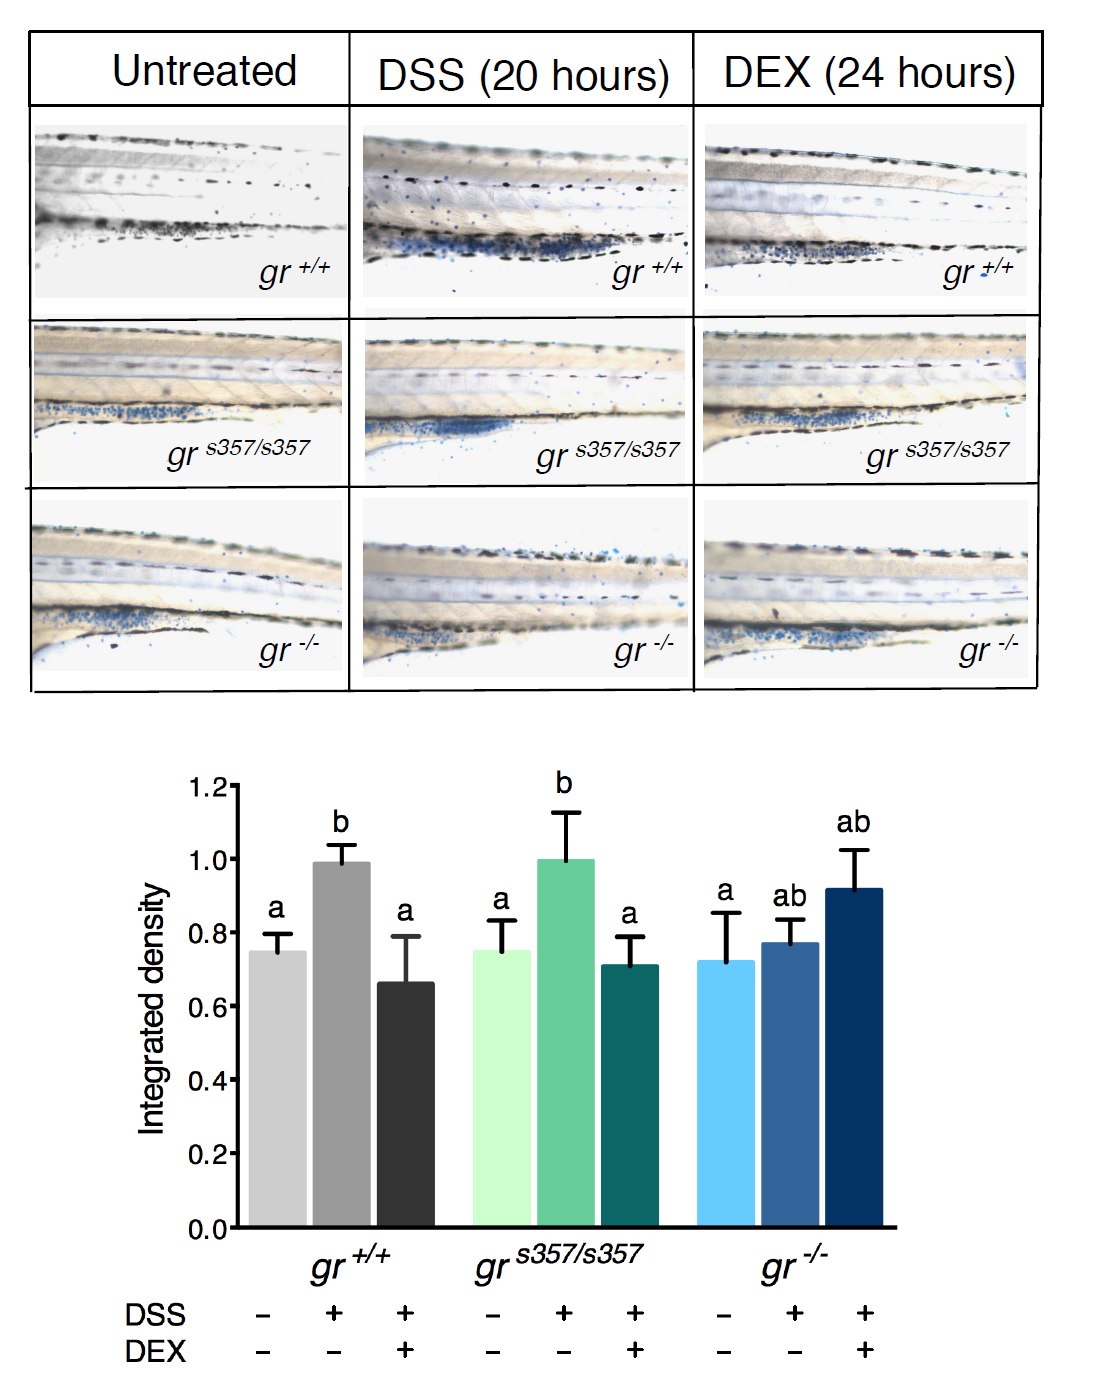
Fig. S5
(A): Whole-mounts of the posterior intestinal region of control, DSSexposed and DSS plus DEX-exposed larvae of the three genotypes analysed after staining with alcian blue. (B): Comparison of alcian blue-stained mucous granules in the intestine of the above larvae. n = 15 larvae for each group. Values represent the mean ± SEM. Different letters indicate statistically significant differences checked by two-way ANOVA followed by Fisher’s post hoc test (p<0.05).
Acknowledgments
This image is the copyrighted work of the attributed author or publisher, and
ZFIN has permission only to display this image to its users.
Additional permissions should be obtained from the applicable author or publisher of the image.
Full text @ Sci. Rep.