
Image
|
Figure Caption
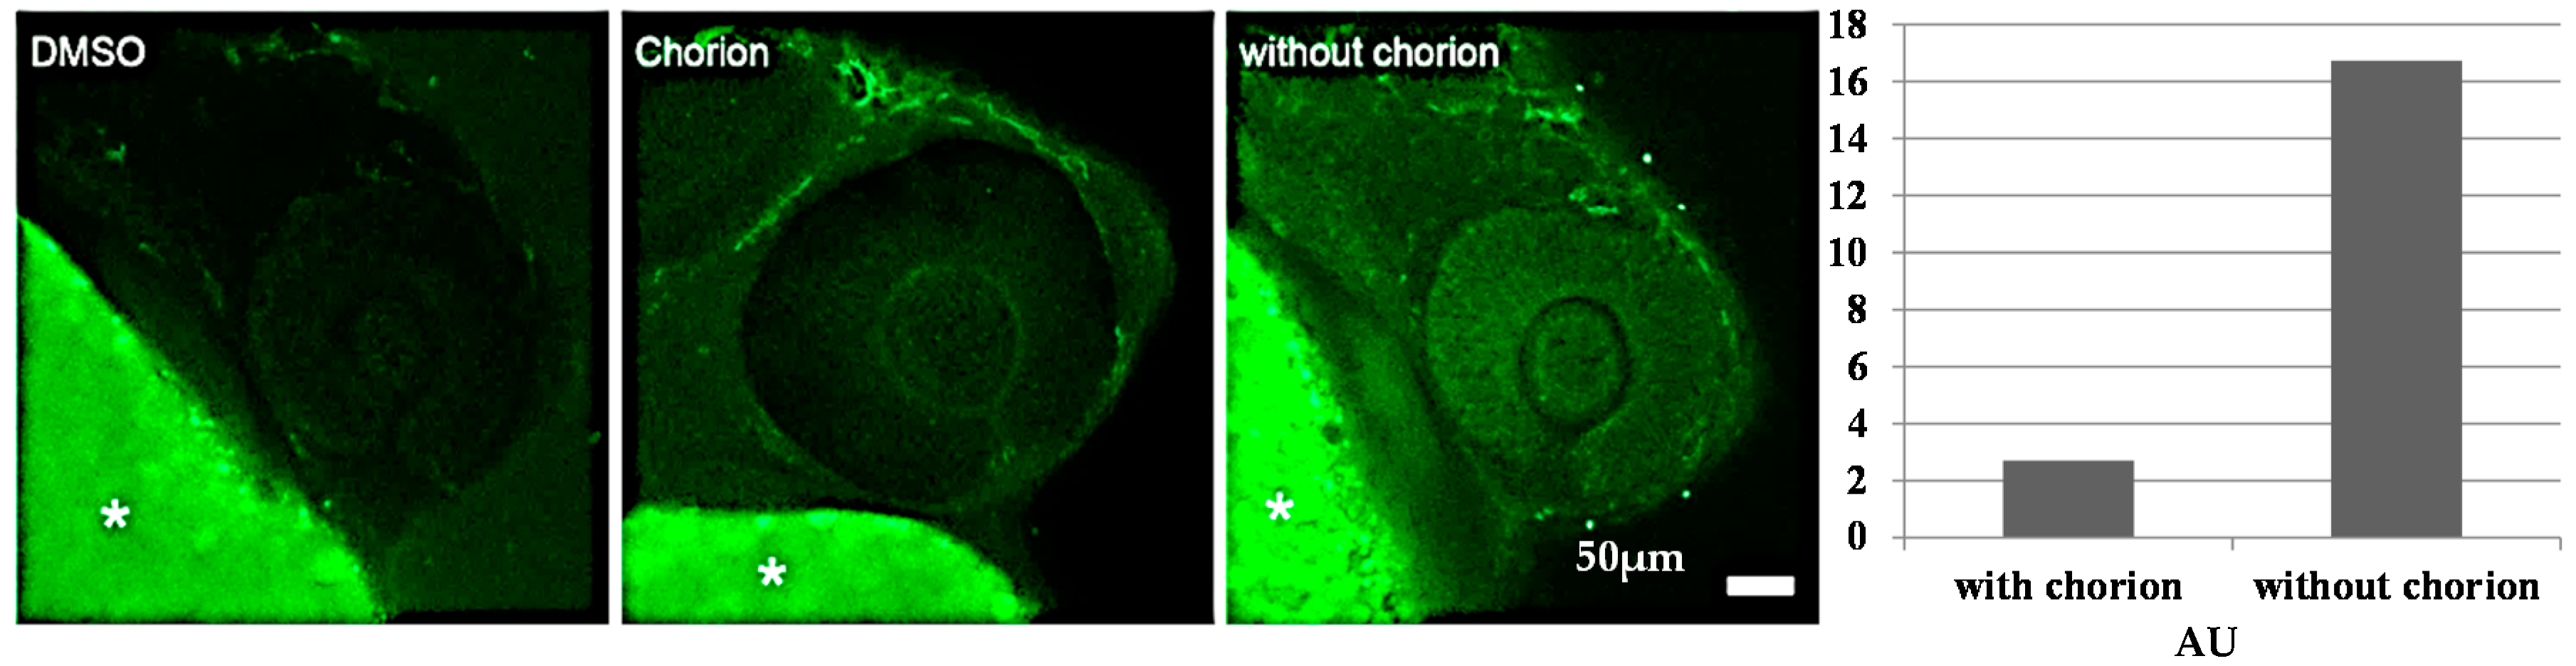
Fig. 8
Differential distribution of GAT1033 in embryos with and without chorion. The microscopy images on the left show the eye and parts of the yolk of 24-hpf zebrafish embryos. The intrinsic fluorescence of the compound was revealed using a laser scanning confocal microscope, after 18 h of incubation. The yolk (marked with *) shows a strong autofluorescence under these imaging conditions. The graph on the right shows the quantitation of fluorescence intensity (in arbitrary units AU) in treated embryos with and without chorion.
Acknowledgments
This image is the copyrighted work of the attributed author or publisher, and
ZFIN has permission only to display this image to its users.
Additional permissions should be obtained from the applicable author or publisher of the image.
Full text @ Molecules