
|
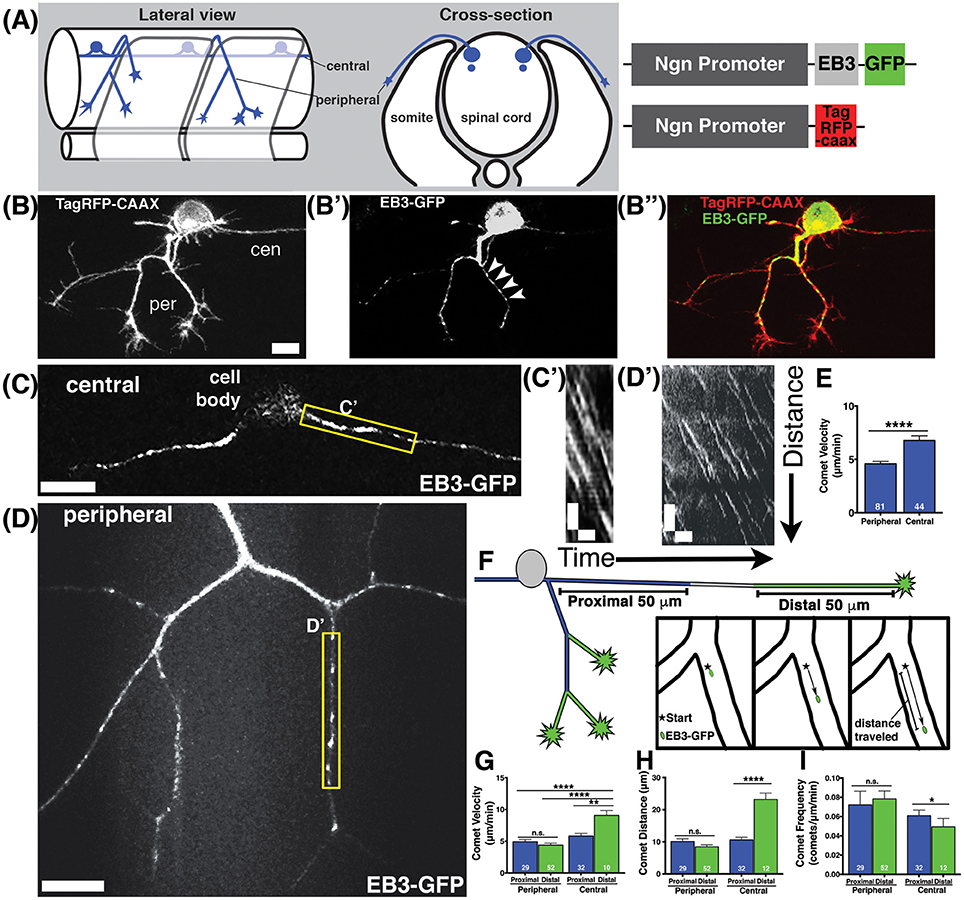
Fig. 1
Characterization of microtubule dynamics in sensory neurons. (A) Schematic of RB neurons and DNA constructs with RB promoter (Ngn) driving expression of EB3-GFP or TagRFP-CAAX to label the plasma membrane. (B) RB neurons labeled with TagRFP-CAAX to visualize the peripheral (per) and central (cen) axons. (B') EB3-GFP labels polymerizing MT plus ends. Representative comets are marked with arrowheads. (B”) Overlay of membrane label (red) and EB3-GFP (green). Scale bars are 10 μm in this and all subsequent neuron images. (C,D) RB neurons expressing EB3-GFP in central axons (C) or peripheral axons (D). (C',D') Representative kymographs were made from regions outlined with yellow box in central axons (C') or peripheral axons (D'). All kymographs are oriented with distance on the y axis (μm) and time on the x axis (minutes) with the proximal origin at the top left and the first time point on the left. Scale bars are 5 μm (y) and 1 min (x) for these and all other kymographs. (E) EB3 comets have greater velocity in central axons than peripheral axons (mean peripheral velocity = 4.578 μm/min, n = 81 axon segments; mean central velocity = 6.769 μm/min, n = 44 axon segments; ****p < 0.0001 student's t-test). (F) Schematic showing proximal (blue) and distal (green) regions of central and peripheral axons, with inset box showing how comet distance was measured. (G) EB3 comets in the distal regions of central axons are significantly faster than those in proximal regions (mean distal central velocity = 9.32 μm/min, n = 12 axon segments; mean proximal central velocity = 5.81 μm/min, n = 32 axon segments, **p = 0.0002 student's t-test; mean proximal peripheral velocity = 4.90 μm/min, n = 29 axon segments, ****p < 0.0001 student's t-test; mean distal peripheral velocity = 4.40 μm/min, n = 52 axon segments, ****p < 0.0001 student's t-test). (H) Central axon comets travel further in distal regions than proximal ones (mean proximal central distance = 10.63 μm, n = 32 axon segments; mean distal central distance = 23.20 μm, n = 12 axon segments; ****p < 0.0001 student's t-test). (I) Comet frequency is significantly lower in distal central axon segments than proximal segments (mean proximal central frequency = 0.061 comets/μm/min, n = 32 axon segments, mean distal central frequency = 0.040 comets/μm/min, n = 12 axon segments; *p = 0.045 student's t-test).