
|
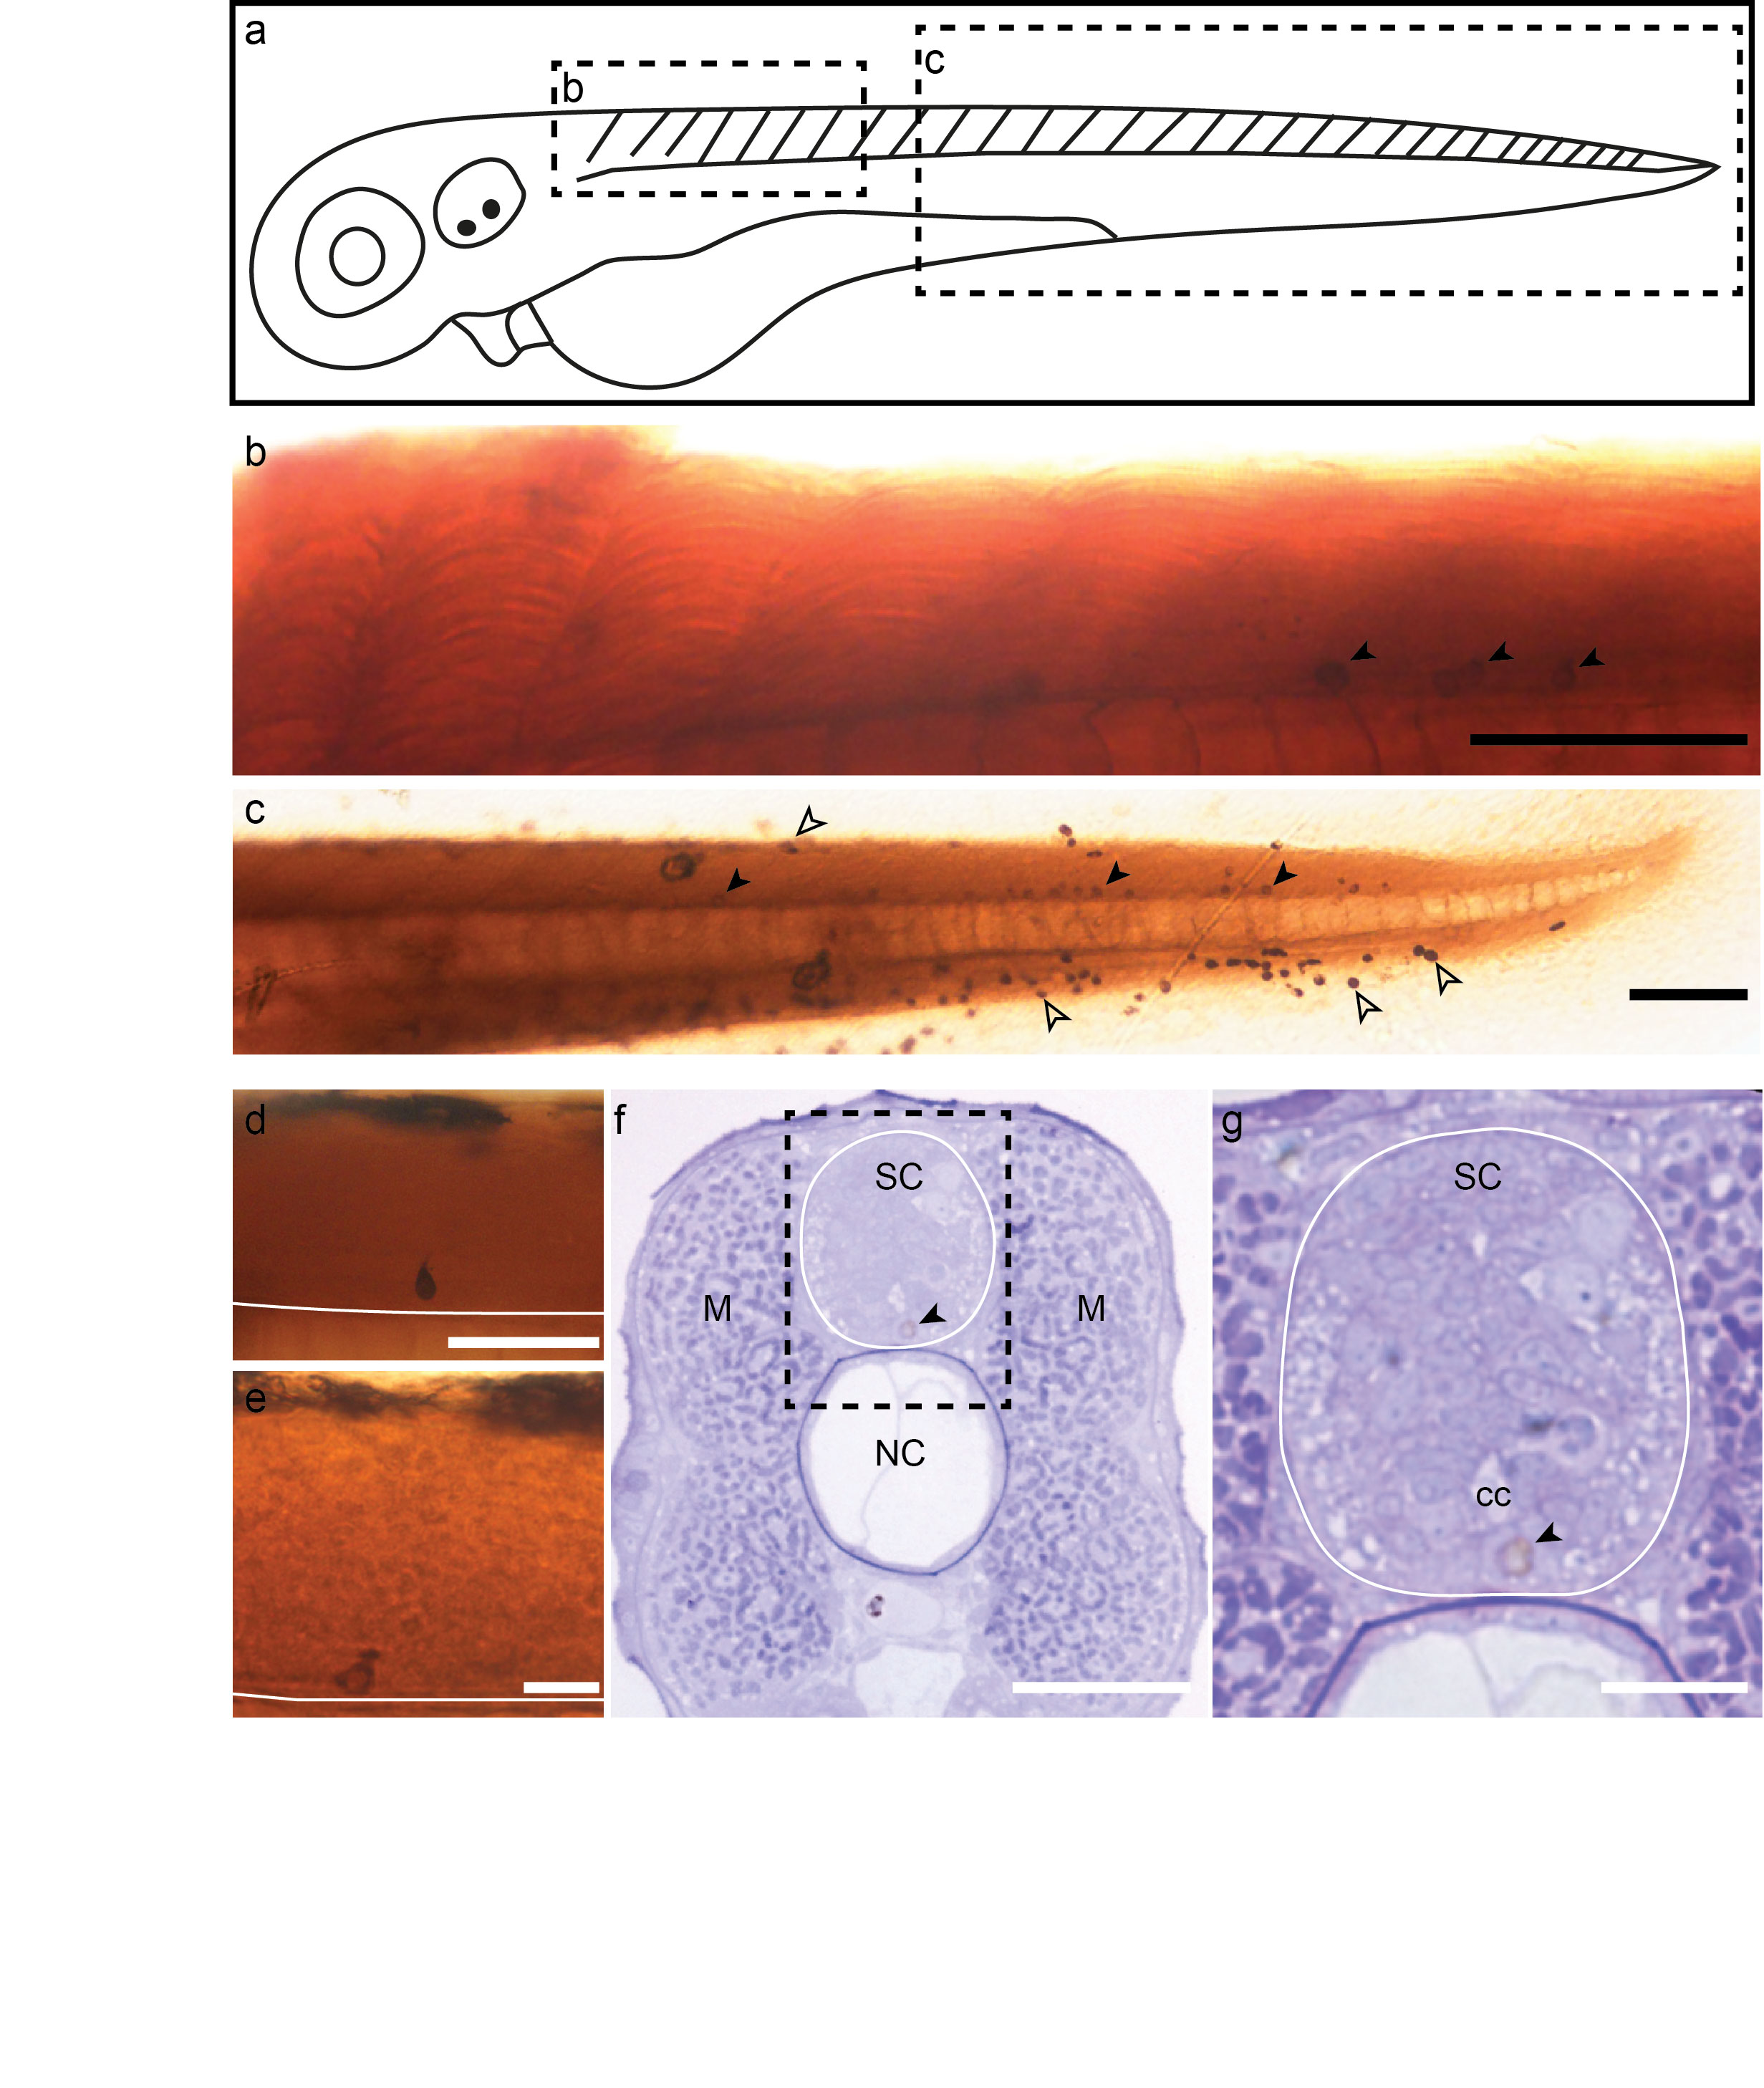
Fig. S3
DAB deposition in APEX2 expressing CSF-cNs enables EM contrast in the spinal cord.
(a) Scheme of a 2.5 dpf larva showing the regions displayed in b and c. Lateral view of the rostral (b) and caudal (c) spinal cord of 2.5 dpf Tg(pkd2l1:Gal4)icm10 larvae injected with (UAS:APEX2- TagRFP) and revealed by DAB. Note the DAB+ CSF-cNs (arrowheads). (d-e) Close-ups showing that DAB+ cells are CSF-cNs characterized by their peculiar apical extension. White line represents the ventral limit of the spinal cord. (f-g) Transverse section showing in the spinal cord (SC) the specificity of the DAB deposition in a ventral CSF-cN (arrowhead). NC= notochord. (g) Close-up of the dotted rectangle region in (f) showing the DAB signal (purple) in a ventral CSF-cN (arrowhead) below the central canal (cc). Scale bars: 100 μm (b, c), 50 μm (d-f) and 20 μm (g).