
Image
|
Figure Caption
Fig. 2
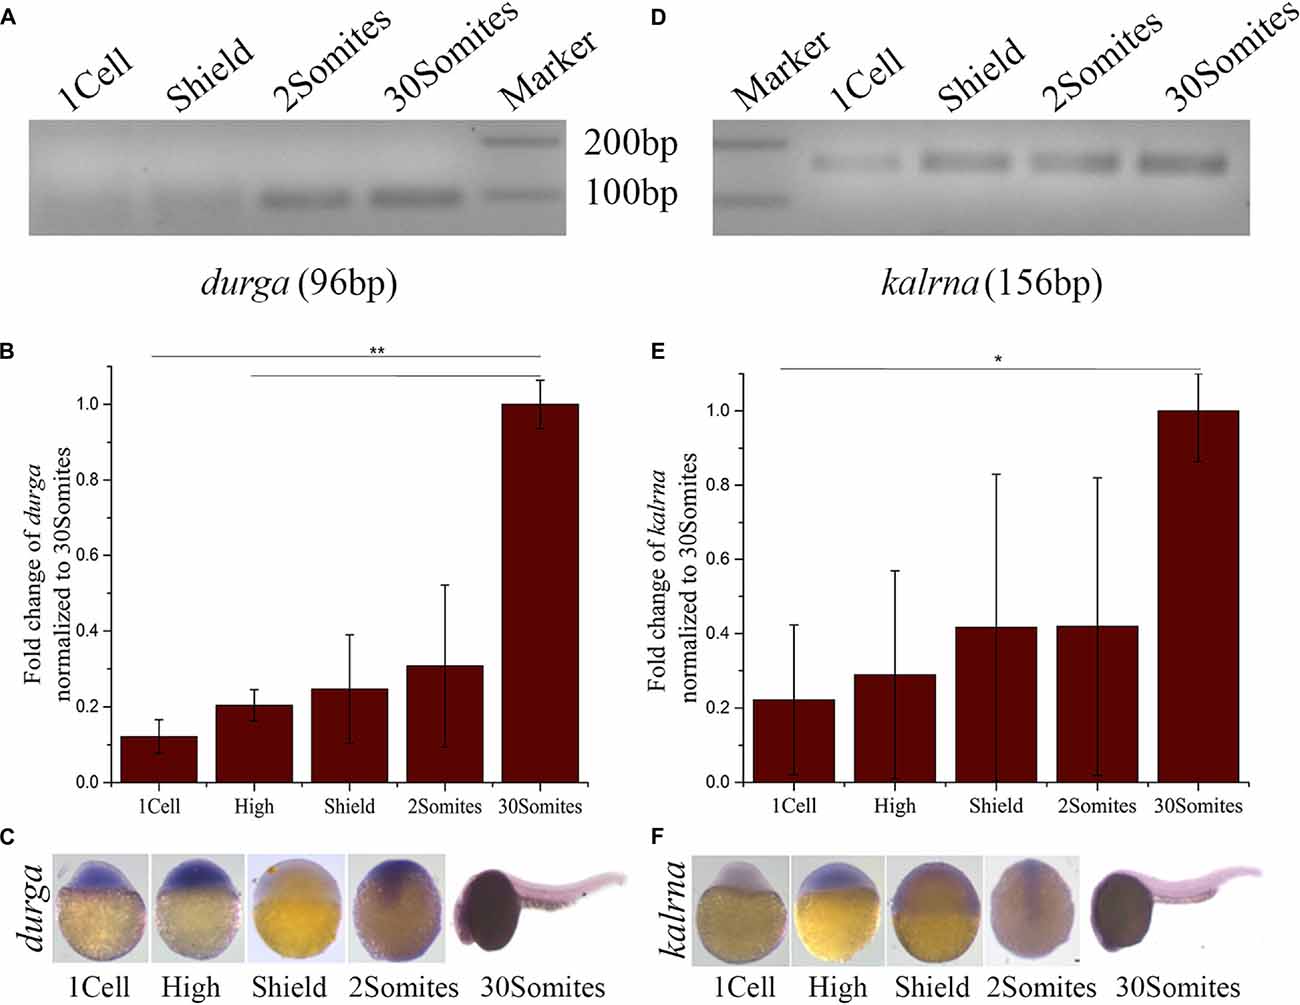
Developmental expression profile of durga and kalrna in zebrafish. (A) Expression of durga and kalrna was checked by semi-quantitative PCR (A,D respectively), qPCR (B,E respectively) and in situ hybridization (C,F respectively) during 1cell, High, Shield, 2Somites, 30Somites stages. Data shown represent more than three independent experiments. p-values were calculated using Student’s t-test. **p ≤ 0.01, *p ≤ 0.05.
Figure Data
Acknowledgments
This image is the copyrighted work of the attributed author or publisher, and
ZFIN has permission only to display this image to its users.
Additional permissions should be obtained from the applicable author or publisher of the image.
Full text @ Front. Mol. Neurosci.