
|
Fig. S6
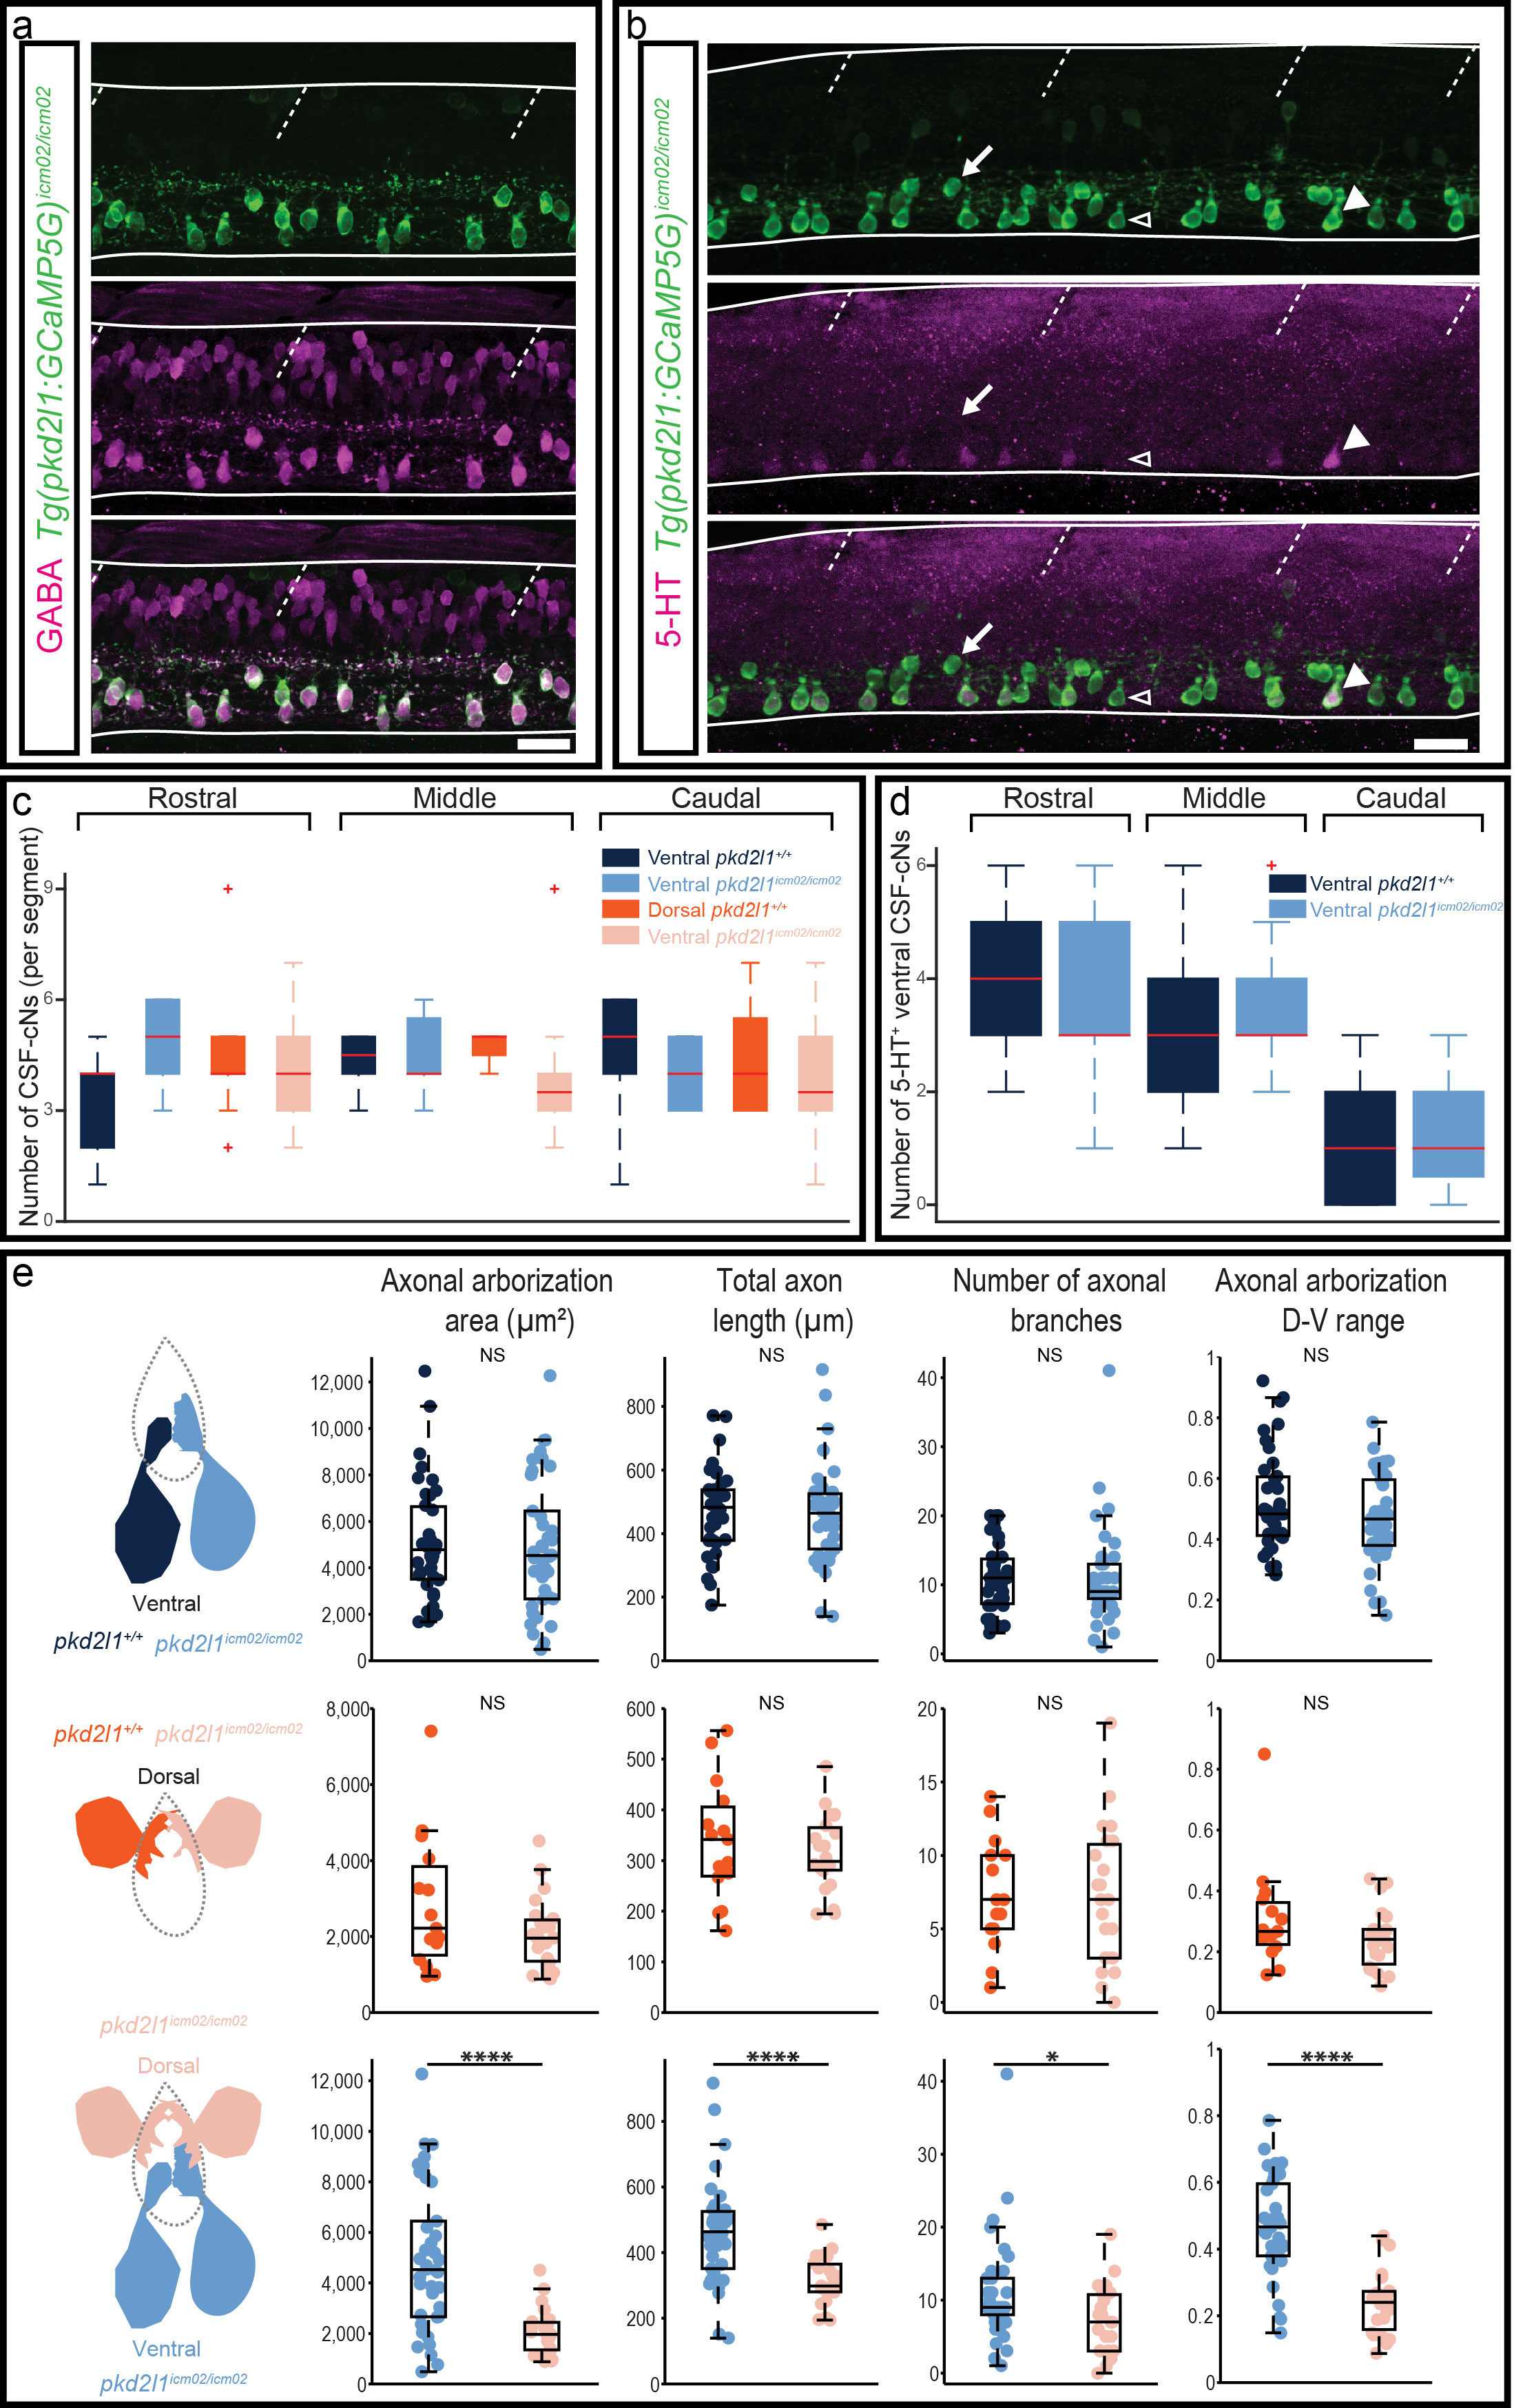
Pkd2l1 is not required for the proper differentiation of spinal CSFcNs
GABA (a, magenta), 5-HT (b, magenta) and GFP (a-b, green) IHCs on pkd2l1icm02/icm02 mutants carrying Tg(pkd2l1:GCaMP5G)icm07 (thus named Tg(pkd2l1:GCaMP5G)icm02/icm02). (a) All CSF-cNs in the mutants express GABA at 72 hpf. (b) At 48 hpf, a large proportion of ventral CSFcNs in the mutants express the 5-HT. Horizontal lines represent the limits of the spinal cord and slash dashed lines represent somites boundaries. Scale bars = 20μm. (c-e) pkd2l1+/+ and pkd2l1icm02/icm02 ventral CSF-cNs are represented in two shades of orange from dark to light respectively. pkd2l1+/+ and pkd2l1icm02/icm02 dorsal CSF-cNs are similarly represented in two shades of blue. (c) Counting of the number of ventral and dorsal CSF-cNs in WT and pkd2l1icm02/icm02 larvae at 3 dpf in three regions of the spinal cord; rostral from segments 3 to 6; middle from segments 10 to 13 and caudal from segments 23 to 26. (d) Counting of the number of 5-HT+ ventral CSF-cNs in 48hpf WT and pkd2l1icm02/icm02 embryos. Two-way ANOVAs were performed to test the interaction between the genotypes and the regions were cells were counted. Red lines represent the median and red crosses represent outliers. (e) Statistical analysis of 39 WT and 38 pkd2l1icm02/icm02 ventral CSF-cNs, 15 WT and 23 pkd2l1icm02/icm02 dorsal CSF-cNs, and 38 pkd2l1icm02/icm02 ventral and 23 pkd2l1icm02/icm02 dorsal CSF-cNs comparing the two populations for the axonal arborization area (p ventral WT versus ventral pkd2l1icm02/icm02 = 0.8192; p dorsal WT versus dorsal pkd2l1icm02/icm02 = 0.0956; p ventral pkd2l1icm02/icm02 versus dorsal pkd2l1icm02/icm02 = 2.2 10-5), the total axon length (p ventral WT versus ventral pkd2l1icm02/icm02 = 0.7743; p dorsal WT versus dorsal pkd2l1icm02/icm02 = 0.4241; p ventral pkd2l1icm02/icm02 versus dorsal pkd2l1icm02/icm02 = 8.7 10-5), the number of branches (p ventral WT versus ventral pkd2l1icm02/icm02 = 0.9680; p dorsal WT versus dorsal pkd2l1icm02/icm02 = 0.8210; p ventral pkd2l1icm02/icm02 versus dorsal pkd2l1icm02/icm02 = 0.0242) and the axonal arborization dorso-ventral range (p ventral WT versus ventral pkd2l1icm02/icm02 = 0.1249; p dorsal WT versus dorsal pkd2l1icm02/icm02 = 0.1261; p ventral pkd2l1icm02/icm02 versus dorsal pkd2l1icm02/icm02 = 2.7 10-8). Each dot represents one cell. Two-sample t-tests to compare two populations were performed for the given parameter.