
|
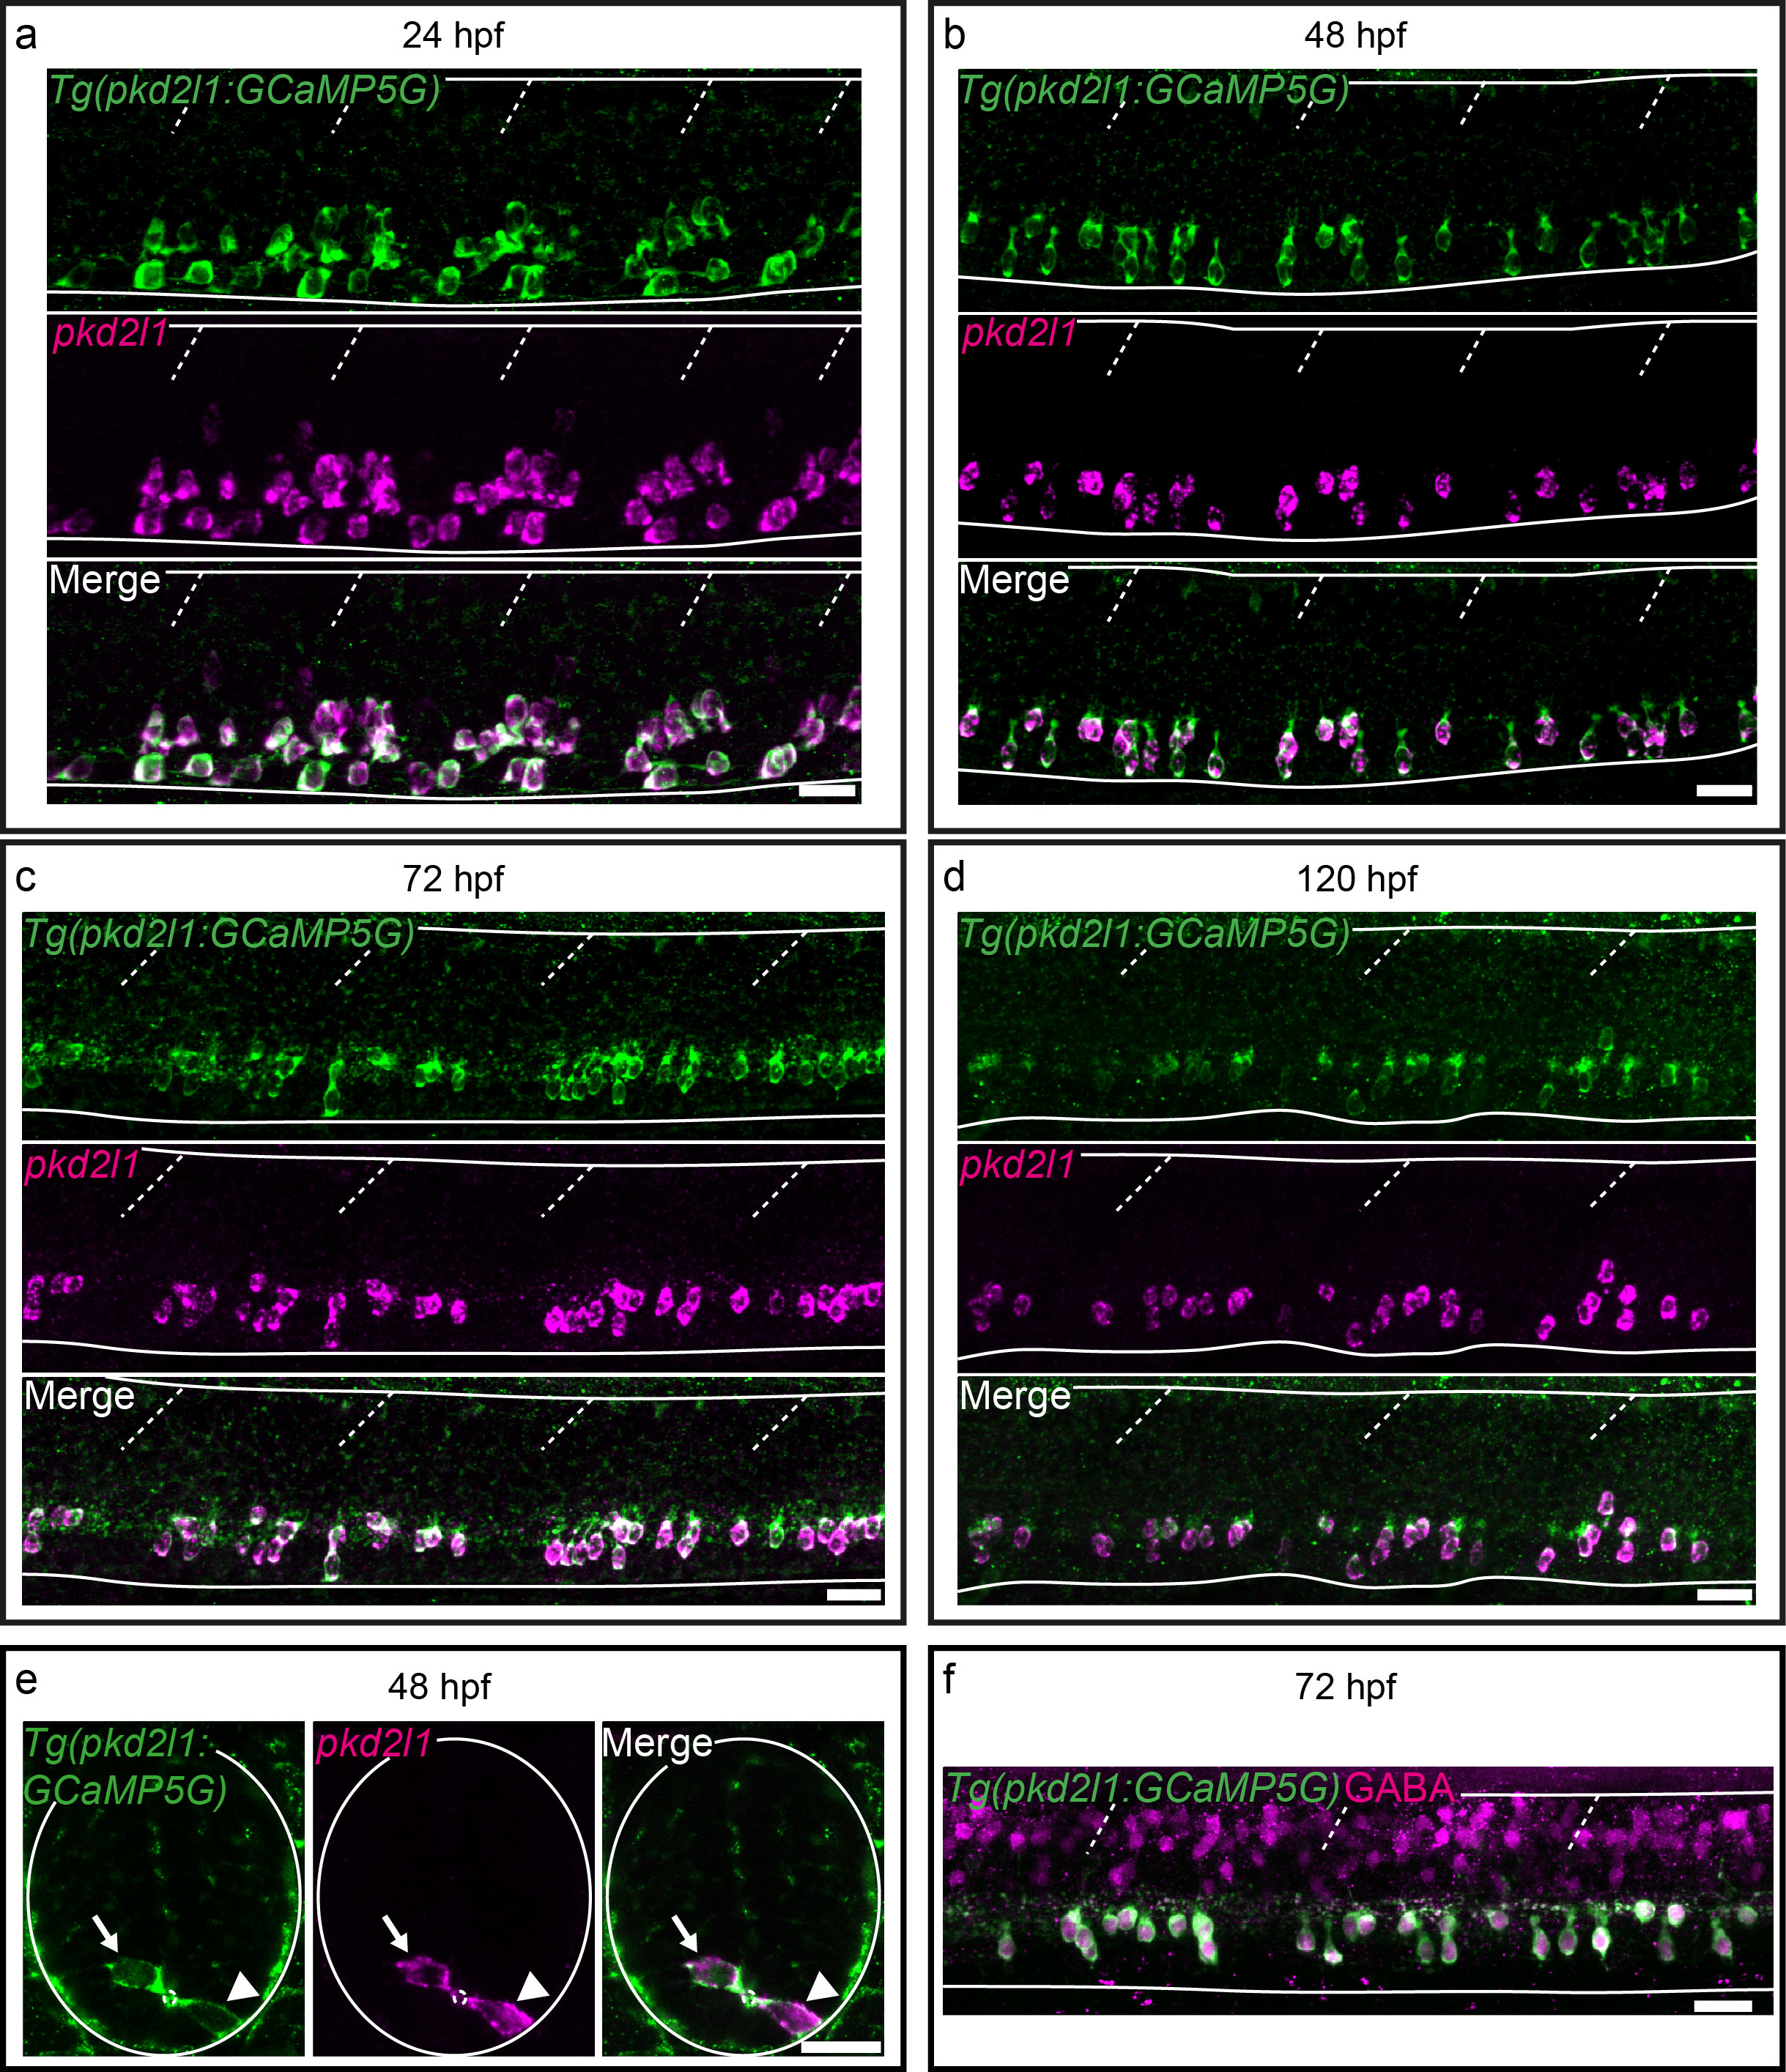
Fig. S5
The Tg(pkd2l1:GCaMP5G)icm07 transgenic line recapitulates endogenous pkd2l1 mRNA expression.
(a-e) FISH for pkd2l1 (magenta) coupled to GFP IHC (green) on Tg(pkd2l1:GCaMP5G) embryos and larvae at 24 hpf (a), 48 hpf (b, e), 72 hpf (c) and 120 hpf (d). (a-d) Lateral views of the spinal cord from segments 10 to 13 show that all GFP+ cells (green) in the Tg(pkd2l1:GCaMP5G) line are pkd2l1+ (magenta). (e) Transverse sections of the spinal cord of 48 hpf embryos show the dorso-ventral distribution of a ventral CSF-cN (arrowhead) ventral to the central canal (small dotted circle) and a dorsal CSF-cNs (arrow) above it. (f) All CSF-cNs in the Tg(pkd2l1:GCaMP5G) line (green) express GABA (magenta). Horizontal lines represent the limits of the spinal cord and slash dashed lines represent somite boundaries. Scale bars = 20μm.