
|
Fig. 4 S2
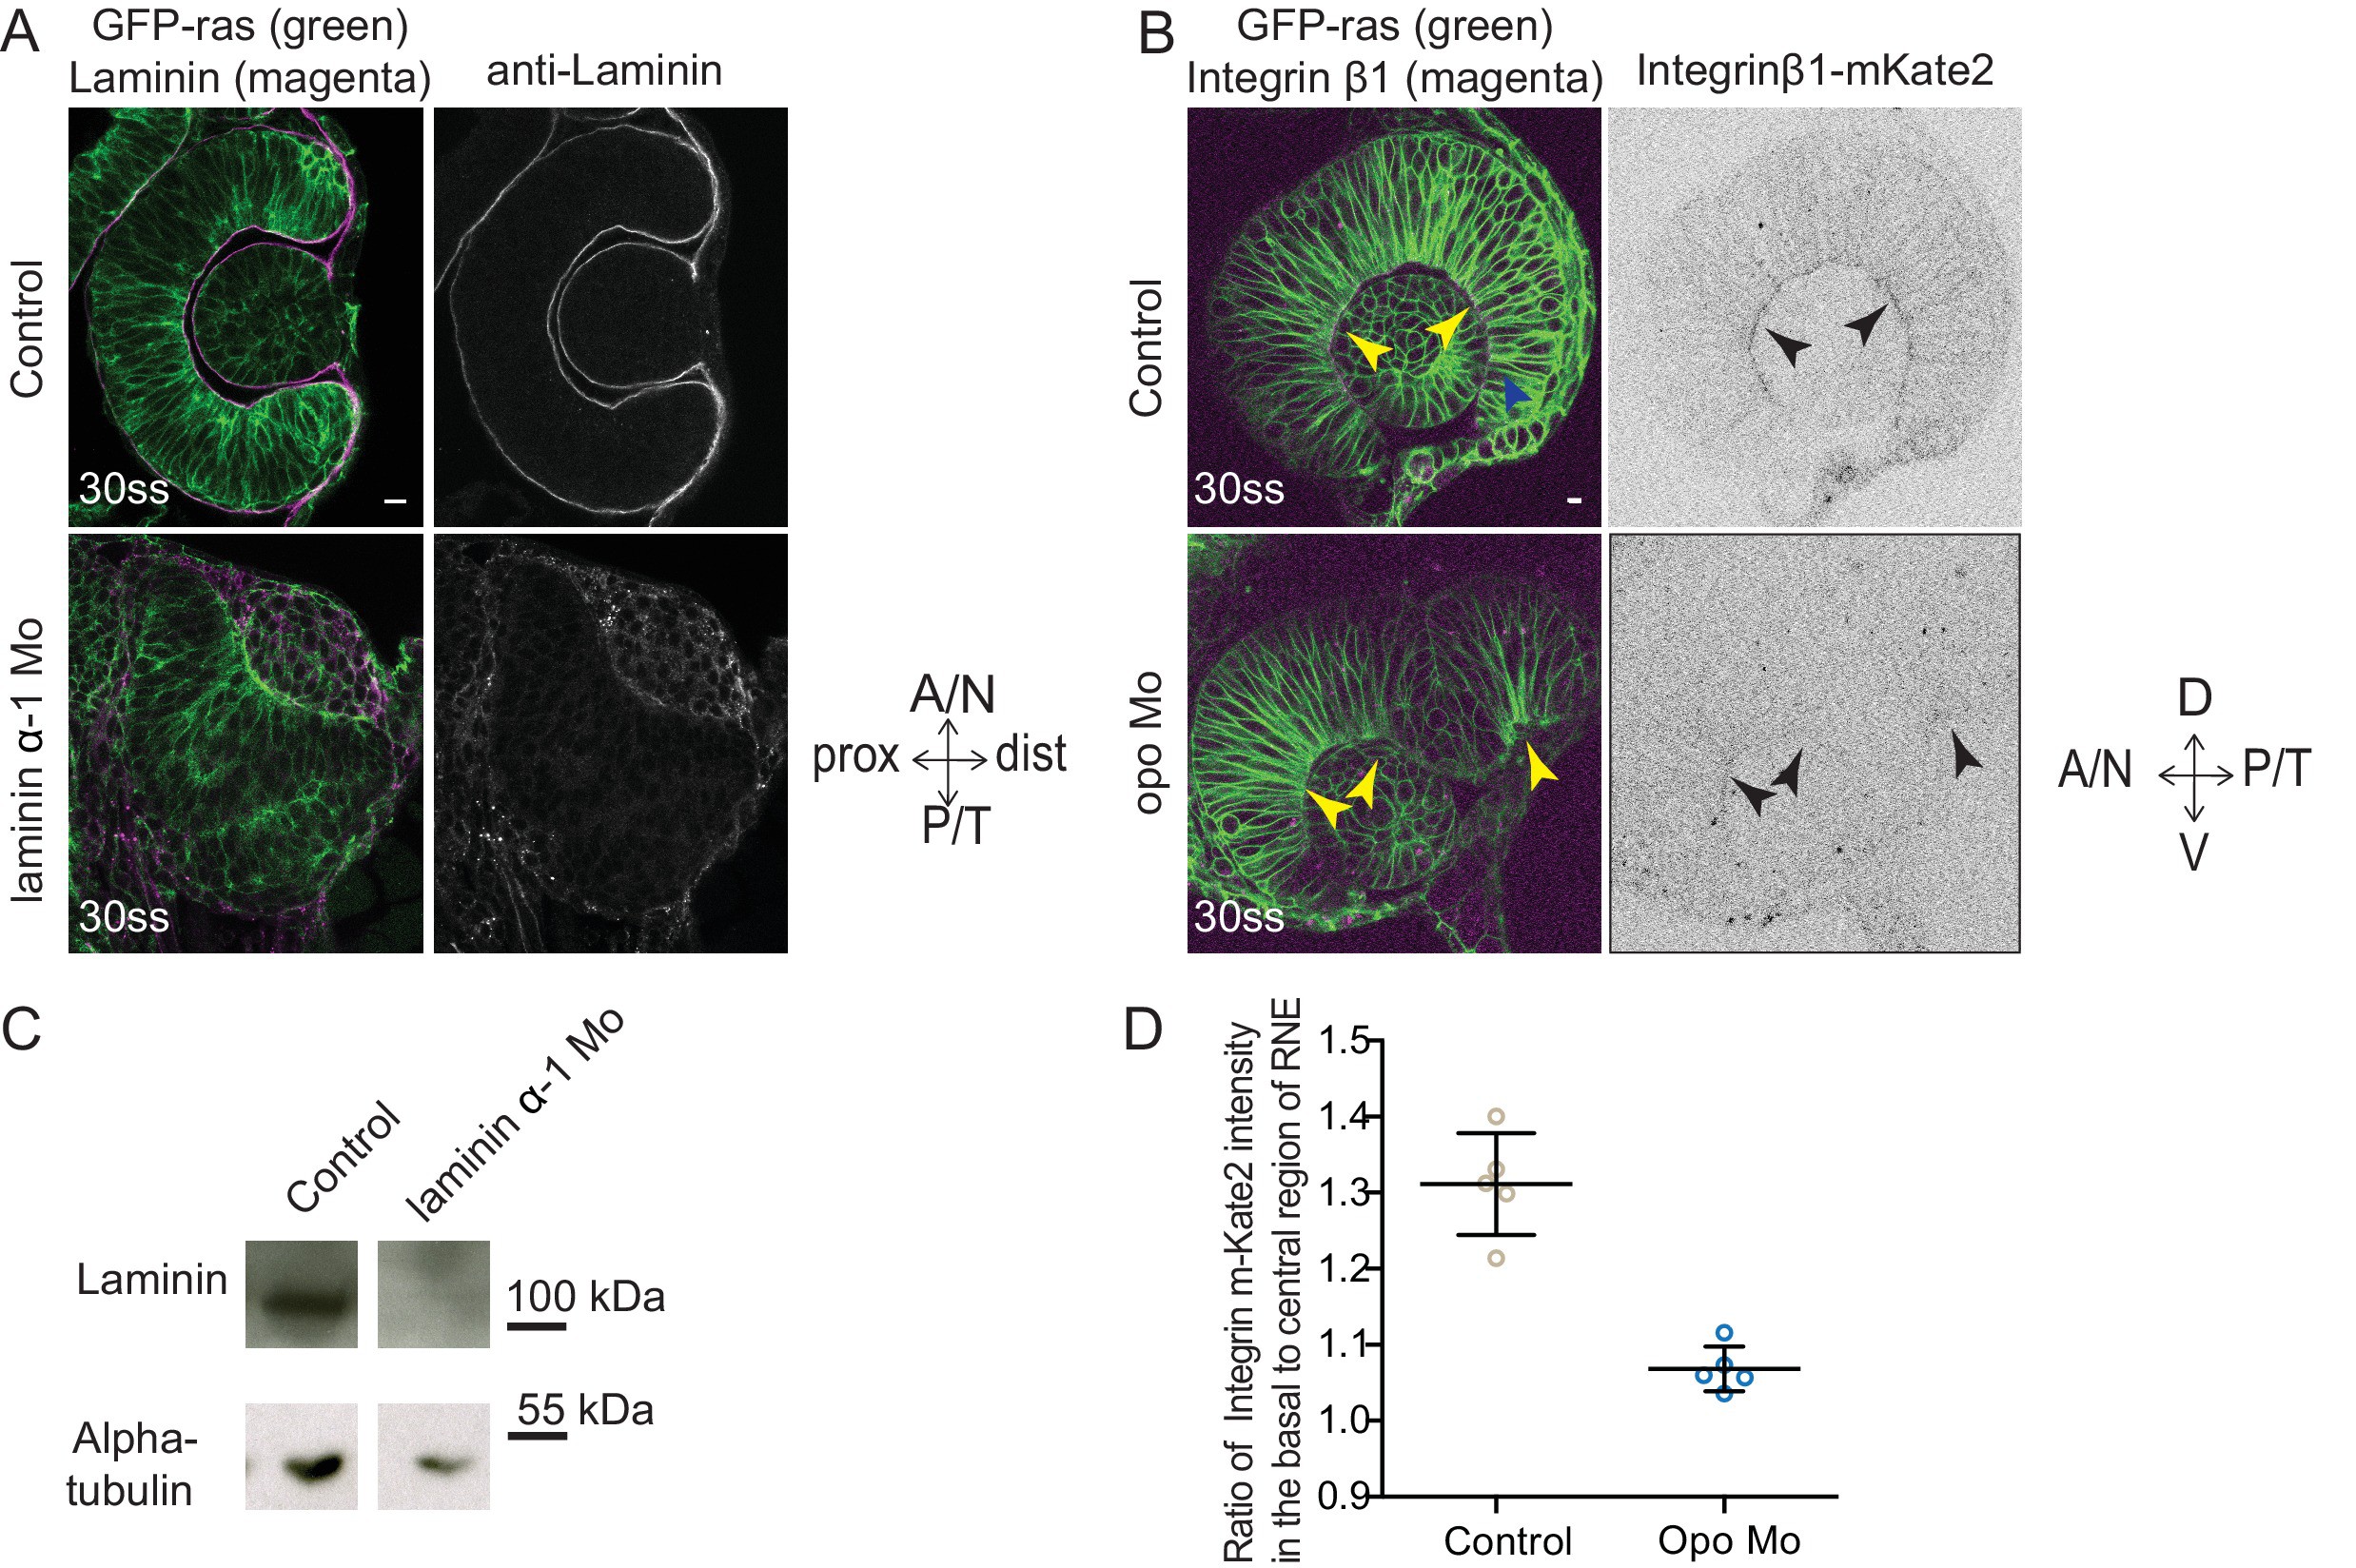
Evaluation of the efficiency of morpholino mediated knockdown of laminin α-1and opo.
(A) Confocal scan of 30 ss RNE in control (top) and laminin morphants (bottom) marked with GFP-ras stained for laminin. Morphant shows S-shaped RNE and reduced laminin staining. Scale bar = 10 µm. (B) Confocal scan of side view of 30 ss RNE in GFP-ras and Integrin-β1-mKate2 RNA injected control (top) and opo morphant (bottom) embryo. Morphant shows S-shaped RNE with secondary invagination zone and highly reduced basal localization of integrin. N = 5. Scale bar = 10 µm. (C) Western blot for laminin and alpha-tubulin in control and laminin morphant. (D) Ratio of average integrin β1-mKate2 signal at the basal to central region in the RNE in optical section along the apicobasal axis of the RNE at 30 ss. Mean ± SD, N = 5 embryos. See Figure 4—source data 1.