
|
Fig. 4 S1
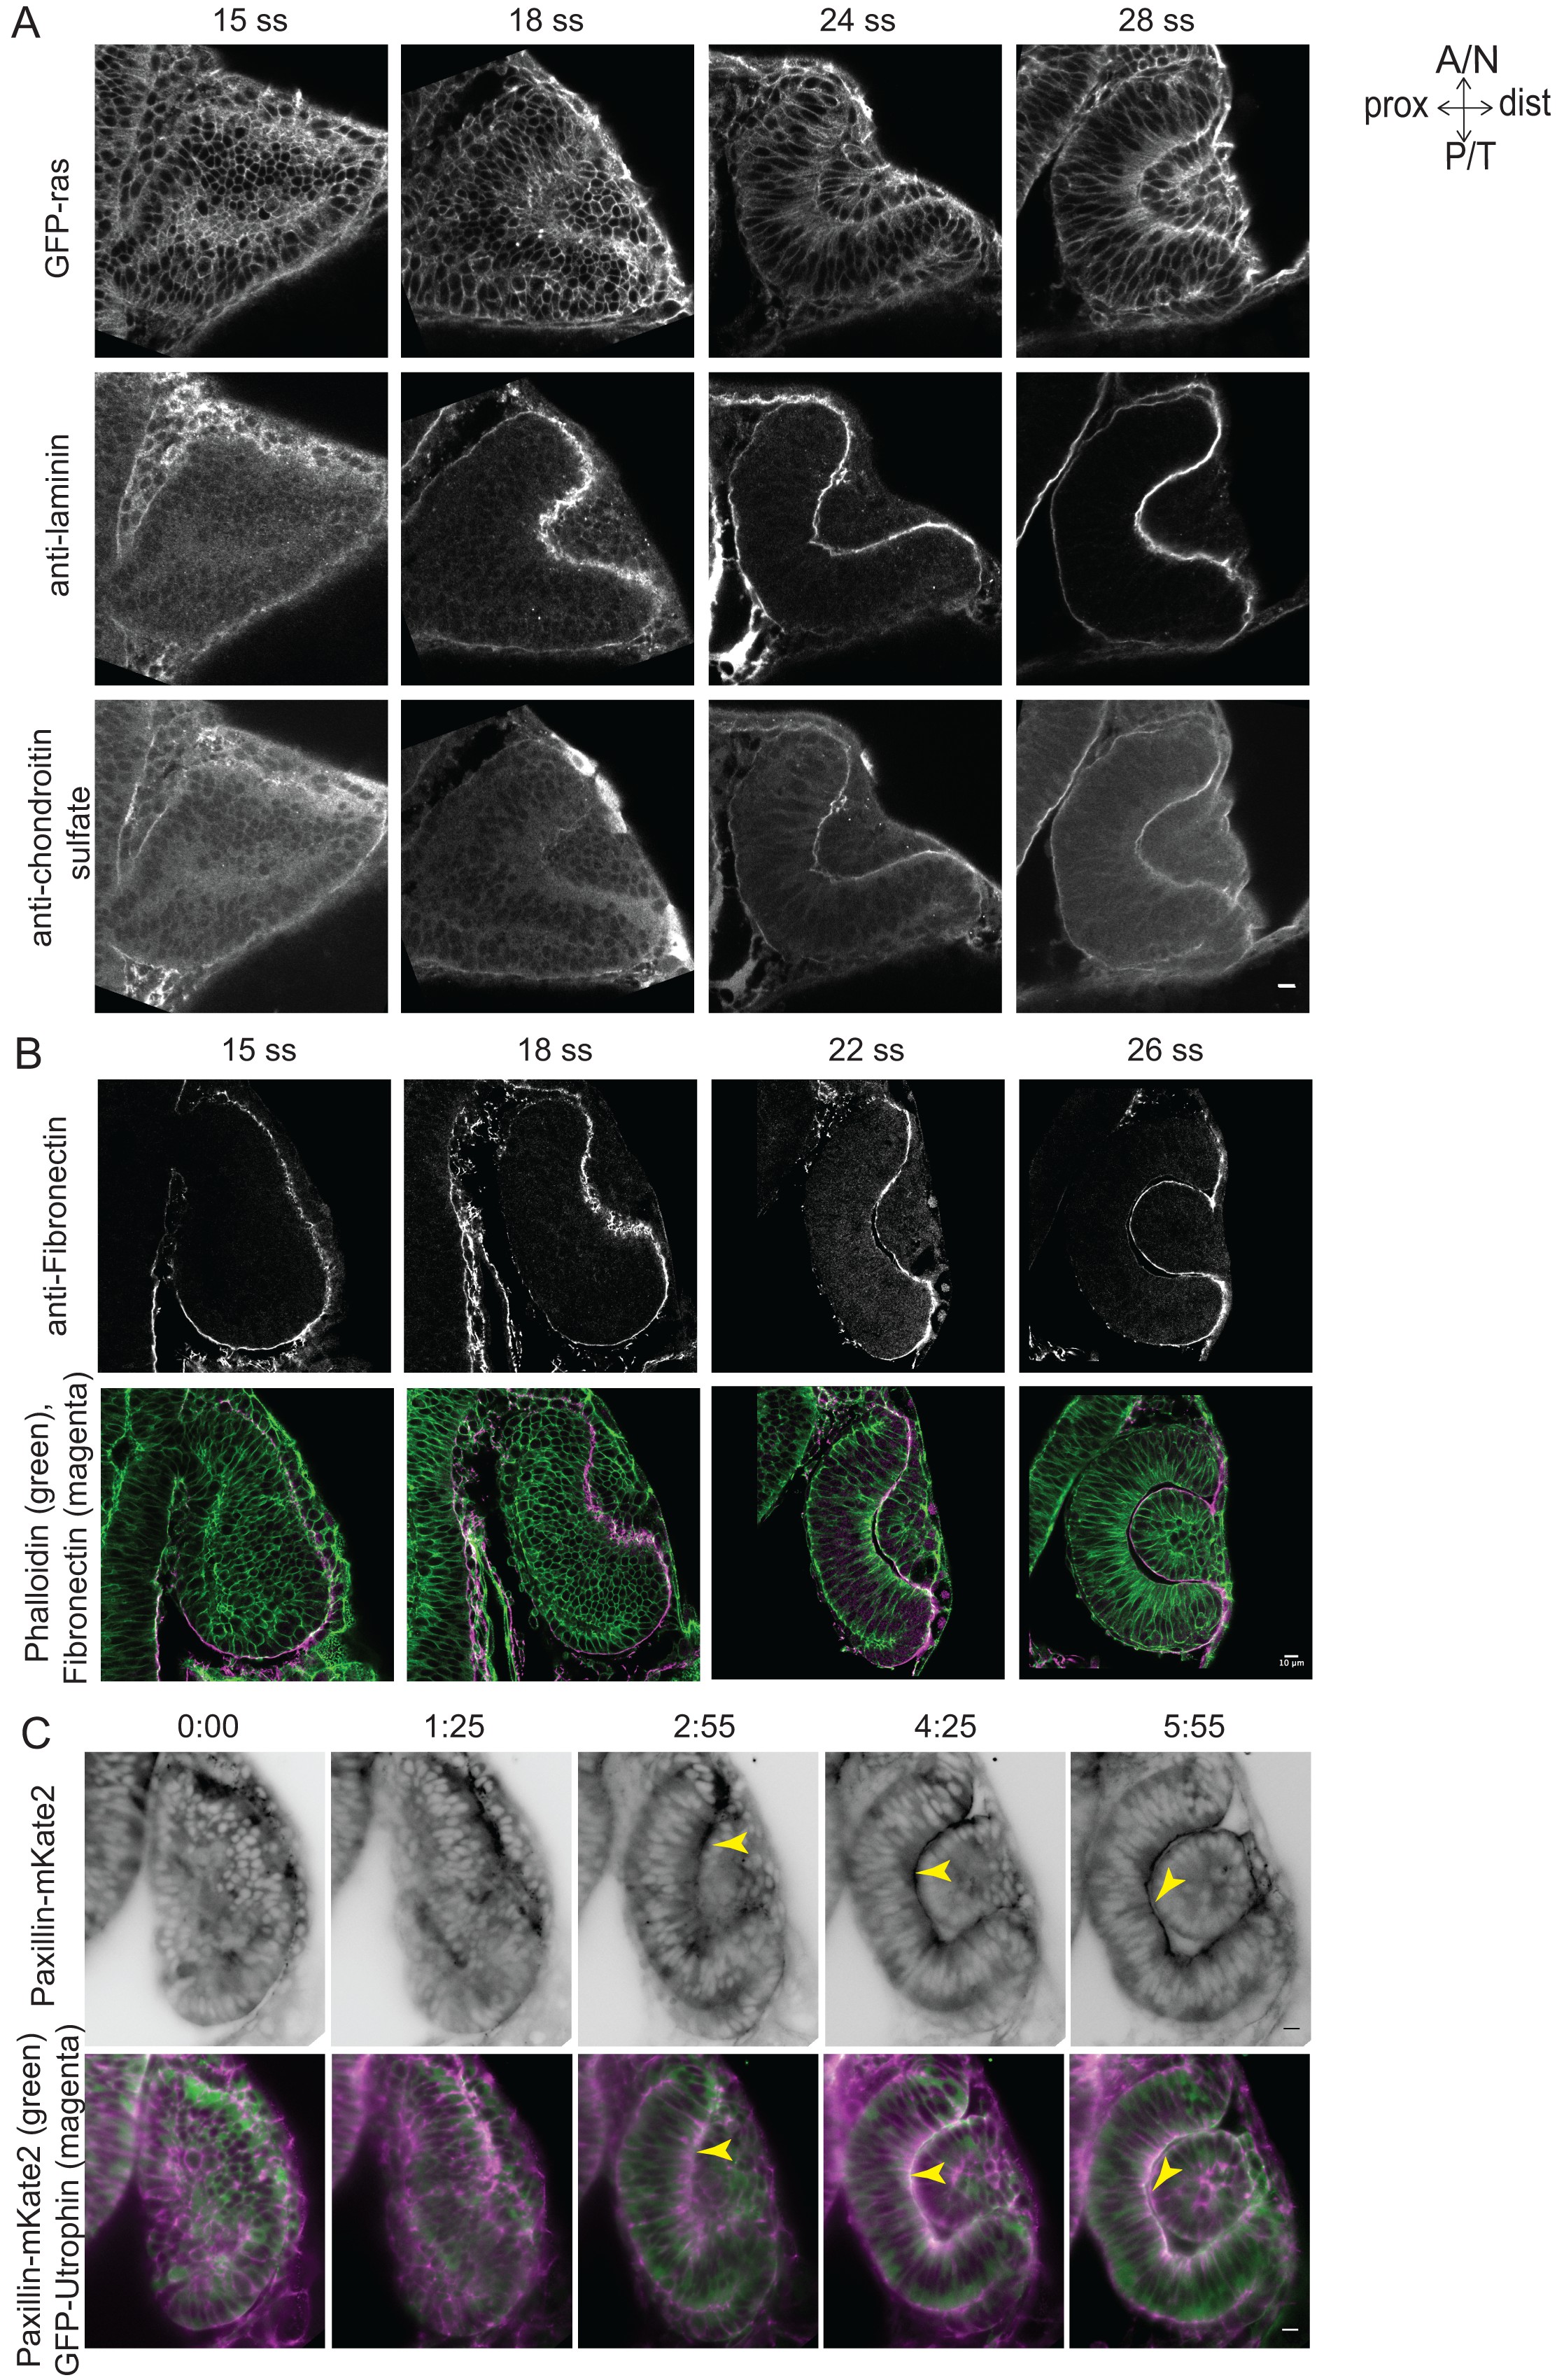
Dynamics of ECM distribution and cell-ECM attachment during RNE morphogenesis.
(A) Confocal scans of immunostainings for laminin (middle) and chondroitin sulfate (bottom) in GFP-ras (top) expressing embryos across different stages of RNE morphogenesis. (B) Confocal scans of immunostainings for Fibronectin (top) and phalloidin across different stages of RNE morphogenesis. Merge (bottom). (C) Time-lapse imaging of RNE morphogenesis in embryos expressing Paxillin-mKate2 and GFP-UtrophinCH. Arrowheads point at paxillin enrichment coinciding with UtrophinCH enrichment. Frames are from Video 12. Imaging started at 15 ss. Time h:min. All scale bars = 10 µm.