
|
Fig. 1 S1
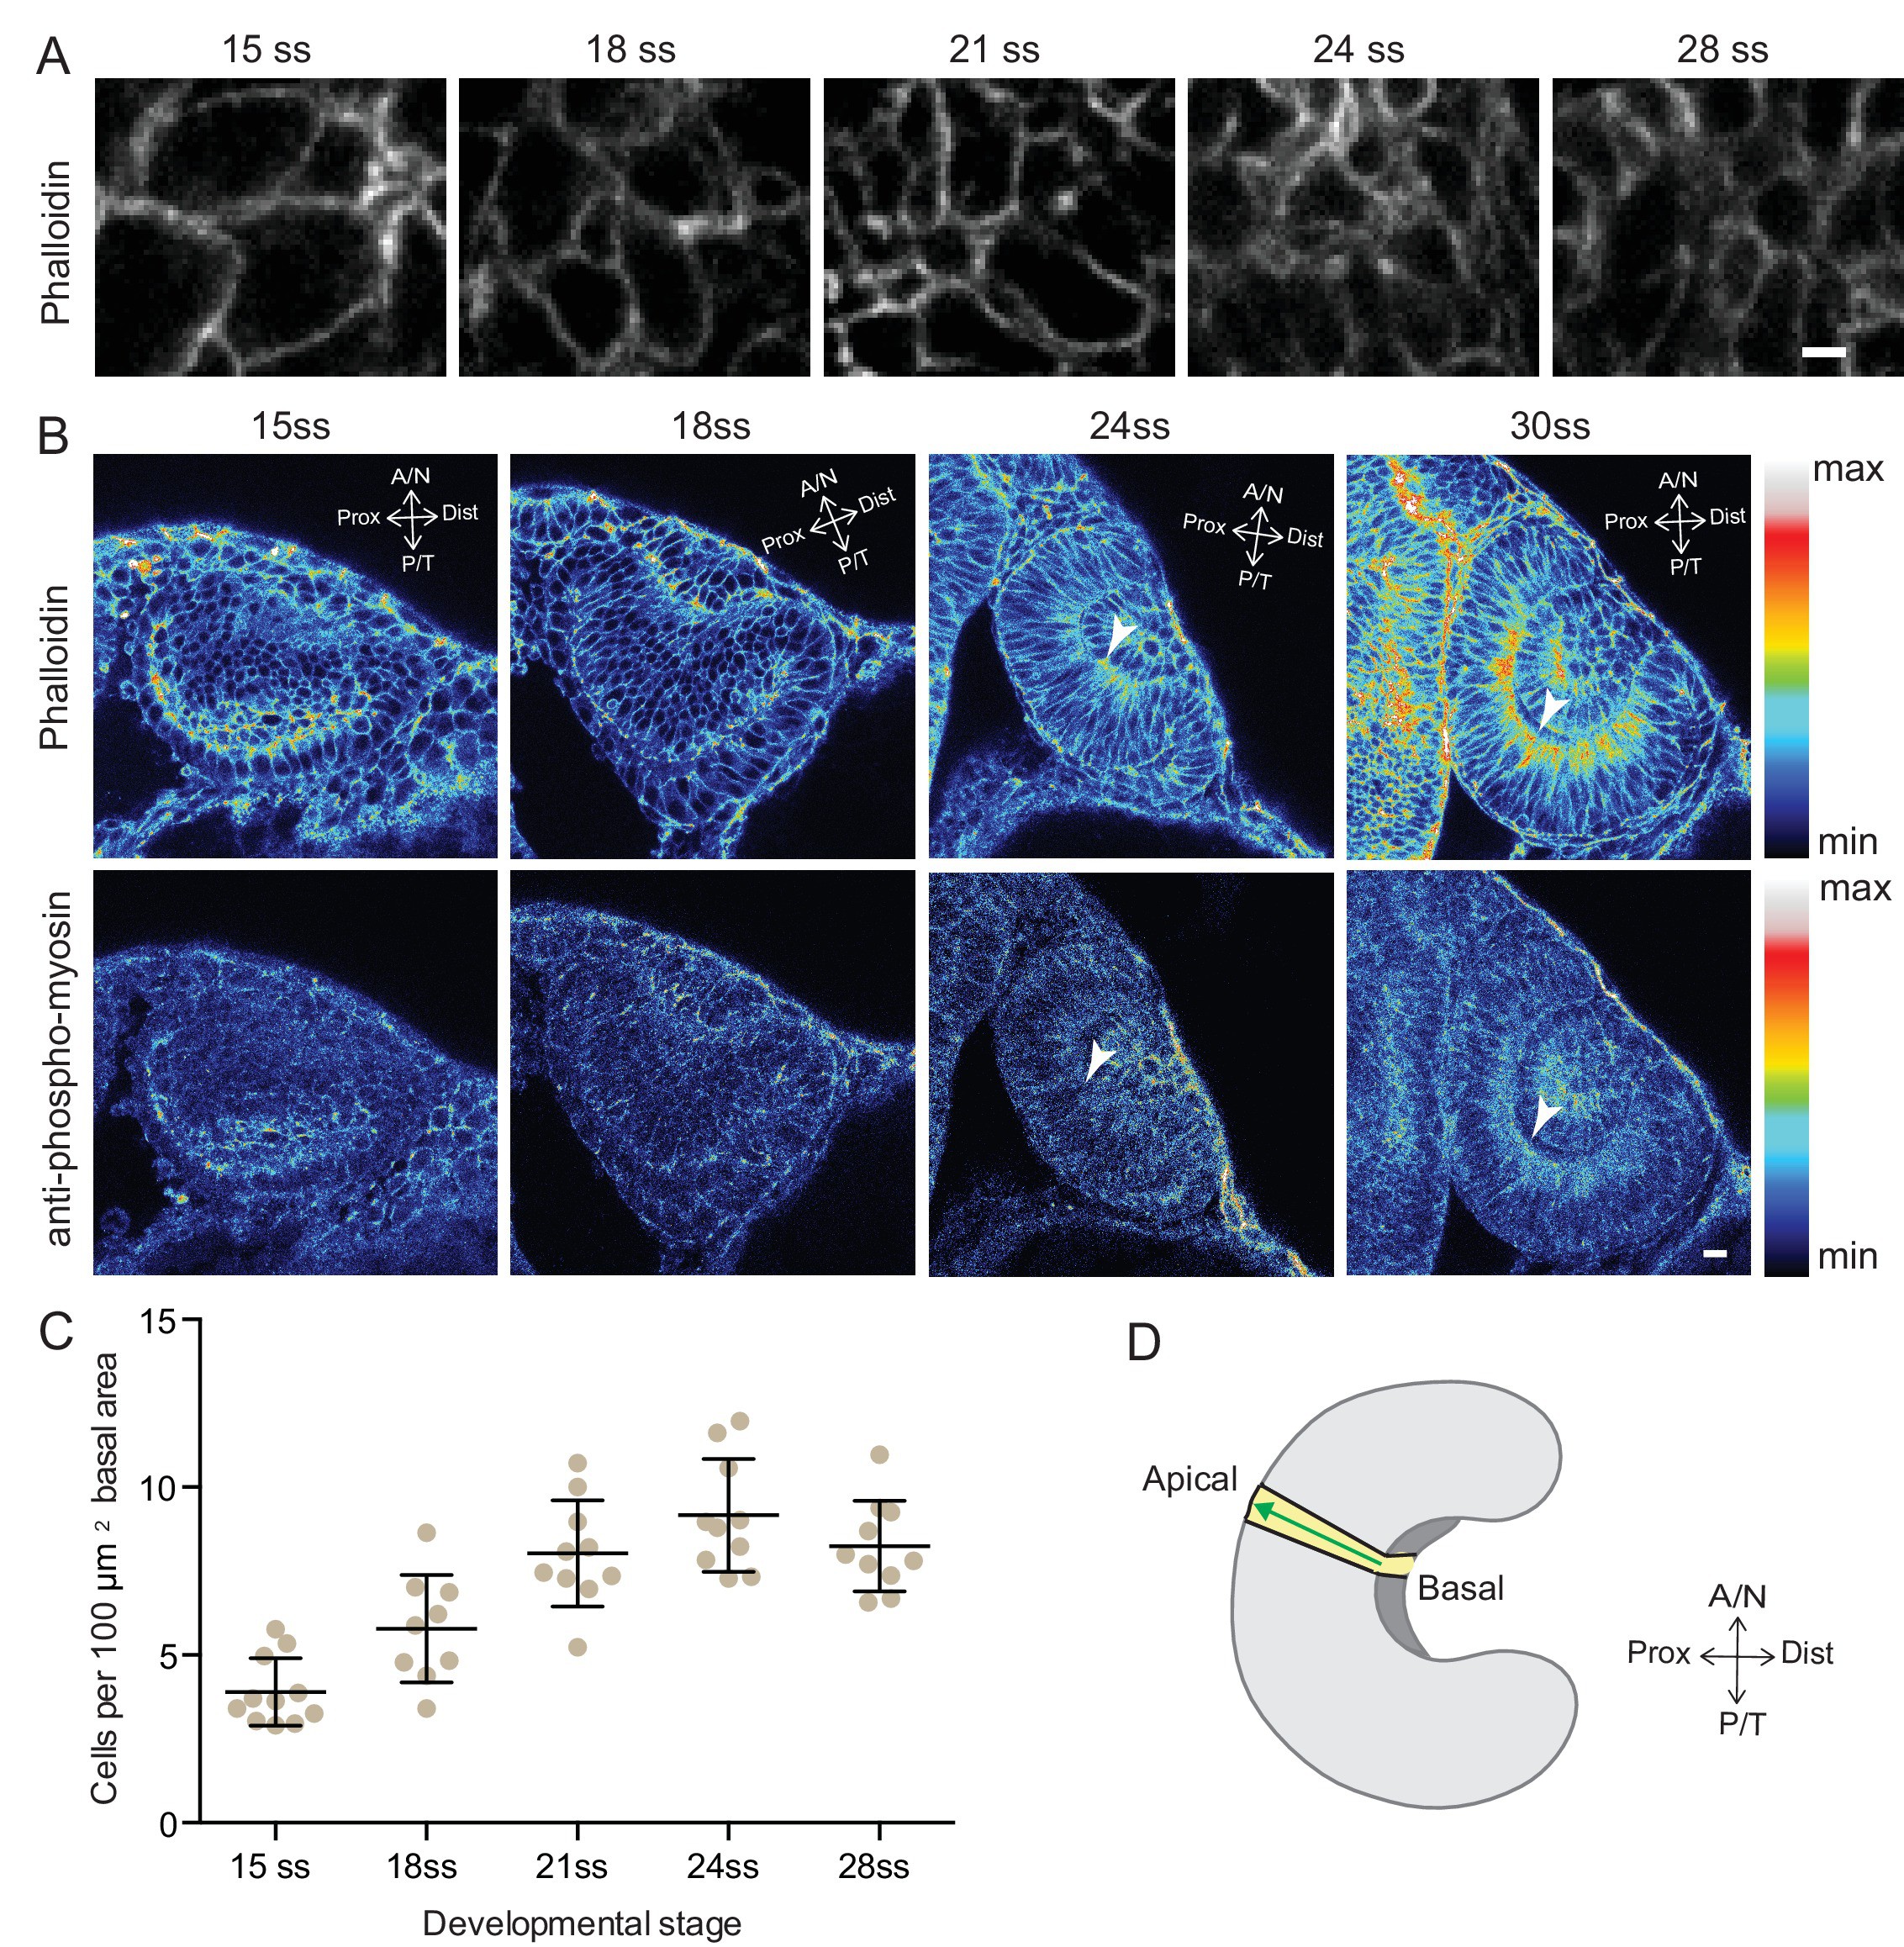
Analysis of the basal surface and actomyosin localisation during RNE invagination.
(A) Confocal scans of the basal side of the RNE cells stained with phalloidin at different developmental stages.Scale bar = 2 µm. (B) Confocal scans of different stages of RNE morphogenesis stained for phalloidin and phosphomyosin. Arrowheads point at basal enrichment. Lookup table indicates the minimum and maximum intensity values. Scale bar = 10 µm. (C) Average number of cells per 100 µm2 basal area of RNE at different stages of development. Mean ± SD, N = 10 embryos each. See Figure 1—source data 1. (D) Schematic drawing of a typical tissue volume used for actomyosin intensity distribution analysis (yellow). The average intensity was measured from basal to apical side of the tissue volume (green arrow) and normalised to the highest intensity value along the axis. See Materials and methods for details.