
|
Fig. 5
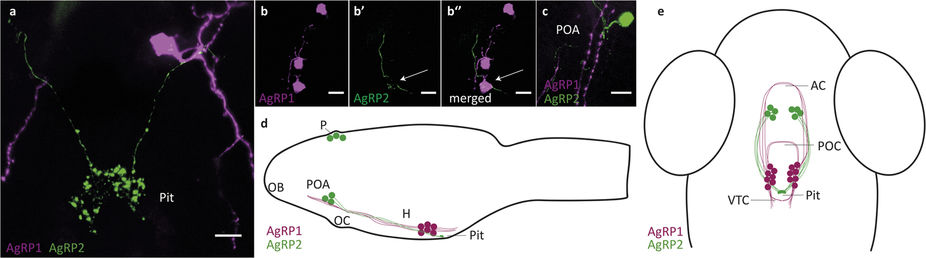
AgRP1 and AgRP2 projections and their interactions.
Analysis of potential interactions between AgRP1 and AgRP2 neurons by crossing of agrp1:mCherry with agrp2:EGFP fish. (a) AgRP2 projections (green) towards the adenohypophysis pass alongside AgRP1 somata (magenta). (b−b'') AgRP2 projections potentially form ‘en passant’ synapses with AgRP1 somata. Arrow points to a swelling along the AgRP2 axon in (b'). (b'') Merged image of (b) and (b'), showing co-localization of AgRP2 axonal swelling (green) and AgRP1 soma (magenta). (c) In the pre-optic area, AgRP1 axons (magenta) pass close to AgRP2 somata (green) and share the same axonal tracks with AgRP2 axons. (d,e) Schematic diagrams showing lateral (d) and dorsal (e) views of the anatomical organization of AgRP1 and AgRP2 neuronal systems in 5-dpf larvae. AC, anterior commissure; H, hypothalamus; OB, olfactory bulb; OC, optic chiasm; P, pineal; Pit, pituitary; POA, pre-optic area; POC, post-optic commissure; VTC, ventral tegmental commissure. Scale bar, 10 μm.