
|
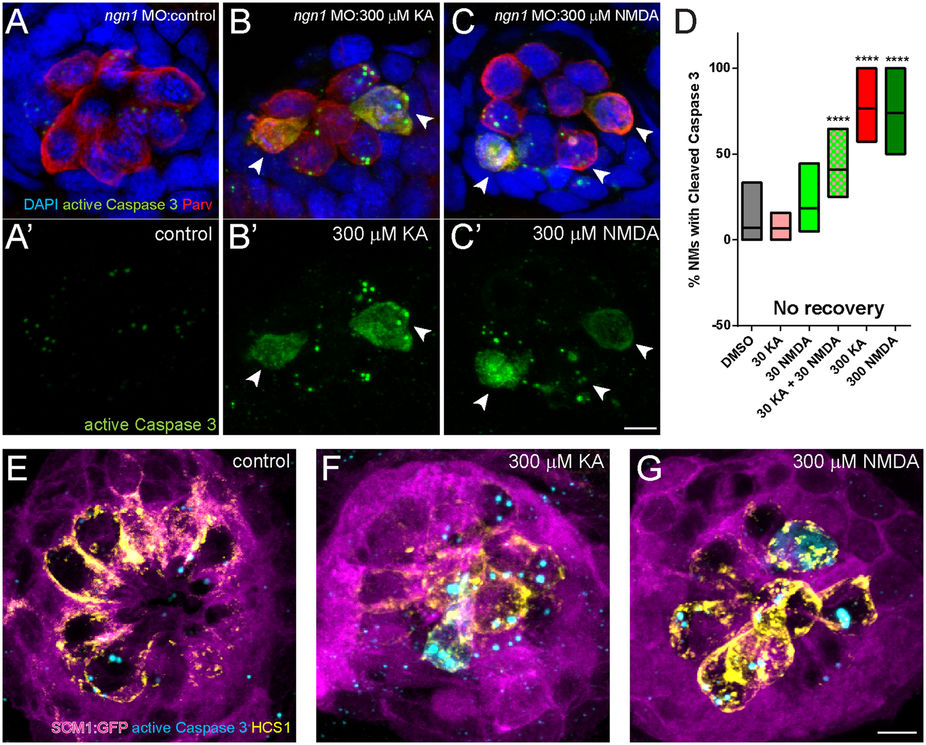
Fig. 7
KA and NMDA exposed NMs contain hair cells with activated Caspase-3.
(A–C): Representative max intensity top-down (x-y) images of NM7 in 5 dpf ngn1 morphant larvae exposed to DMSO alone (A), 300 μM KA (B), or 300 μM NMDA (C), then immediately processed for histology. NMs exposed to iGluR agonists stained positively for activated Caspase-3, indicating the cells were undergoing apoptotic cell death. Scale bar: 3 μm (D) Floating bar graph showing the percentage of NM in individual larval posterior lateral line that stained positive for activated Caspase-3. Each bar represents the min. and max. values in 11–15 larvae; the lines represent the mean values. (****p < 0.0001 defined by Dunnett’s multiple comparisons test). (E–G) Representative max intensity images of NMs in transgenic 5 dpf larvae expressing GFP in lateral-line supporting cells (scm1:GFP) exposed to DMSO alone (E), 300 μM KA (F), or 300 μM NMDA (G), then then immediately processed for histology. Supporting cells (magenta) appear intact in drug-exposed larvae, and activated caspase-3 immunolabel (cyan) corresponds with the hair-cell marker HCS-1 (yellow). Scale bar: 3 μm.