
|
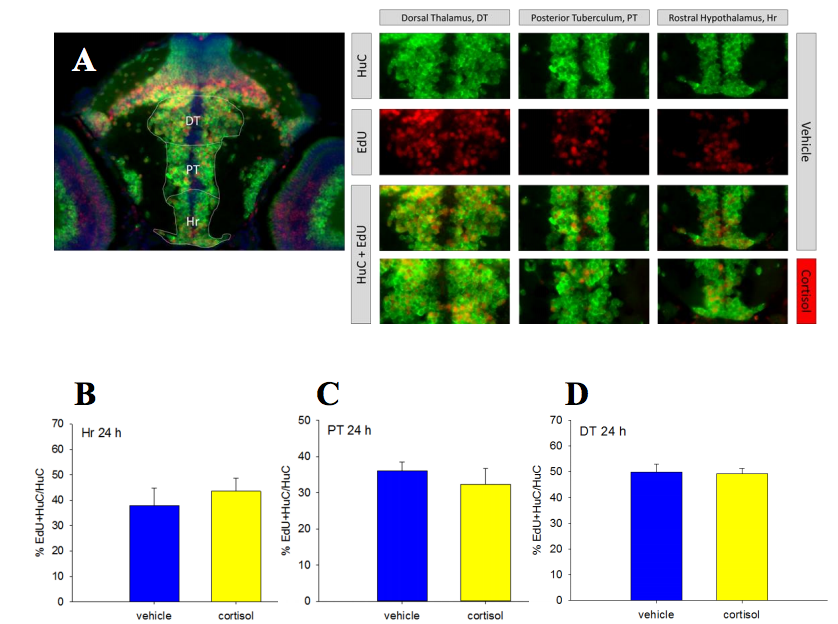
Fig. S1
Neurogenesis in the rostral hypothalamus, posterior tuberculum, and dorsal thalamus in larvae with altered cortisol deposition.
Larvae were pulsed with EdU at 24 hpf and then raised until 5 dpf. A representative image as well as an overlay of staining is shown for each region quantified (control), with a representative image from the cortisol-treated group (A). Regions quantified are (B) rostral hypothalamus, (C) posterior tuberculum, and (D) dorsal thalamus. Red is EdU staining, green is HuC staining and blue is DAPI staining. Values represent means ± SEM, and different letters indicate significant differences (Student’s t-test, unpaired, n=4-5).