
|
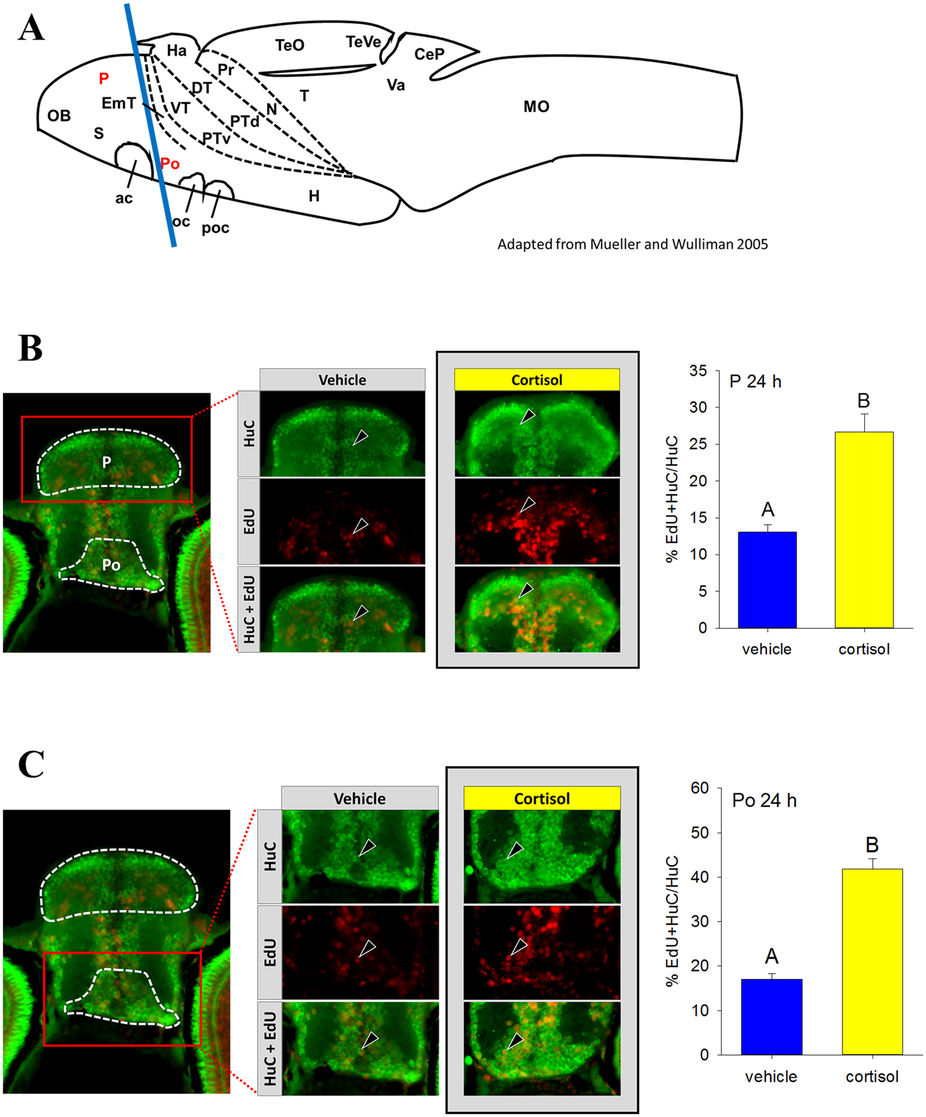
Fig. 2
Excess zygotic cortisol content affects neurogenesis.
(A) A schematic of zebrafish brain showing the regions used for assessing neurogenesis. The regions, including P (pallium) and Po (preoptic region), highlighted in red were, used for assessing neurogenesis. Position of transverse section selected for further analysis is shown by a blue line. See SI Table 1 for full list of abbreviations. Adapted from Mueller and Wulliman66. Neurogenesis in zebrafish pallium (B) and preoptic region (C). Larvae were pulsed with EdU at 24 hpf and raised until 120 hpf. A representative image contains outlines of the regions of interest (white dashed line). Representative sections for vehicle and control groups are shown, with staining for HuC (green), EdU (red) and both merged. Examples of cells co-labelled with EdU and HuC are indicated with arrowheads. Cells were counted by region and total number of new neurons (EdU + HuC) at 24 hpf and was normalized to total number of neurons (HuC). Means ± SEM (n = 3–5 larvae). Different letters indicate significant differences (Student’s t-test).