
|
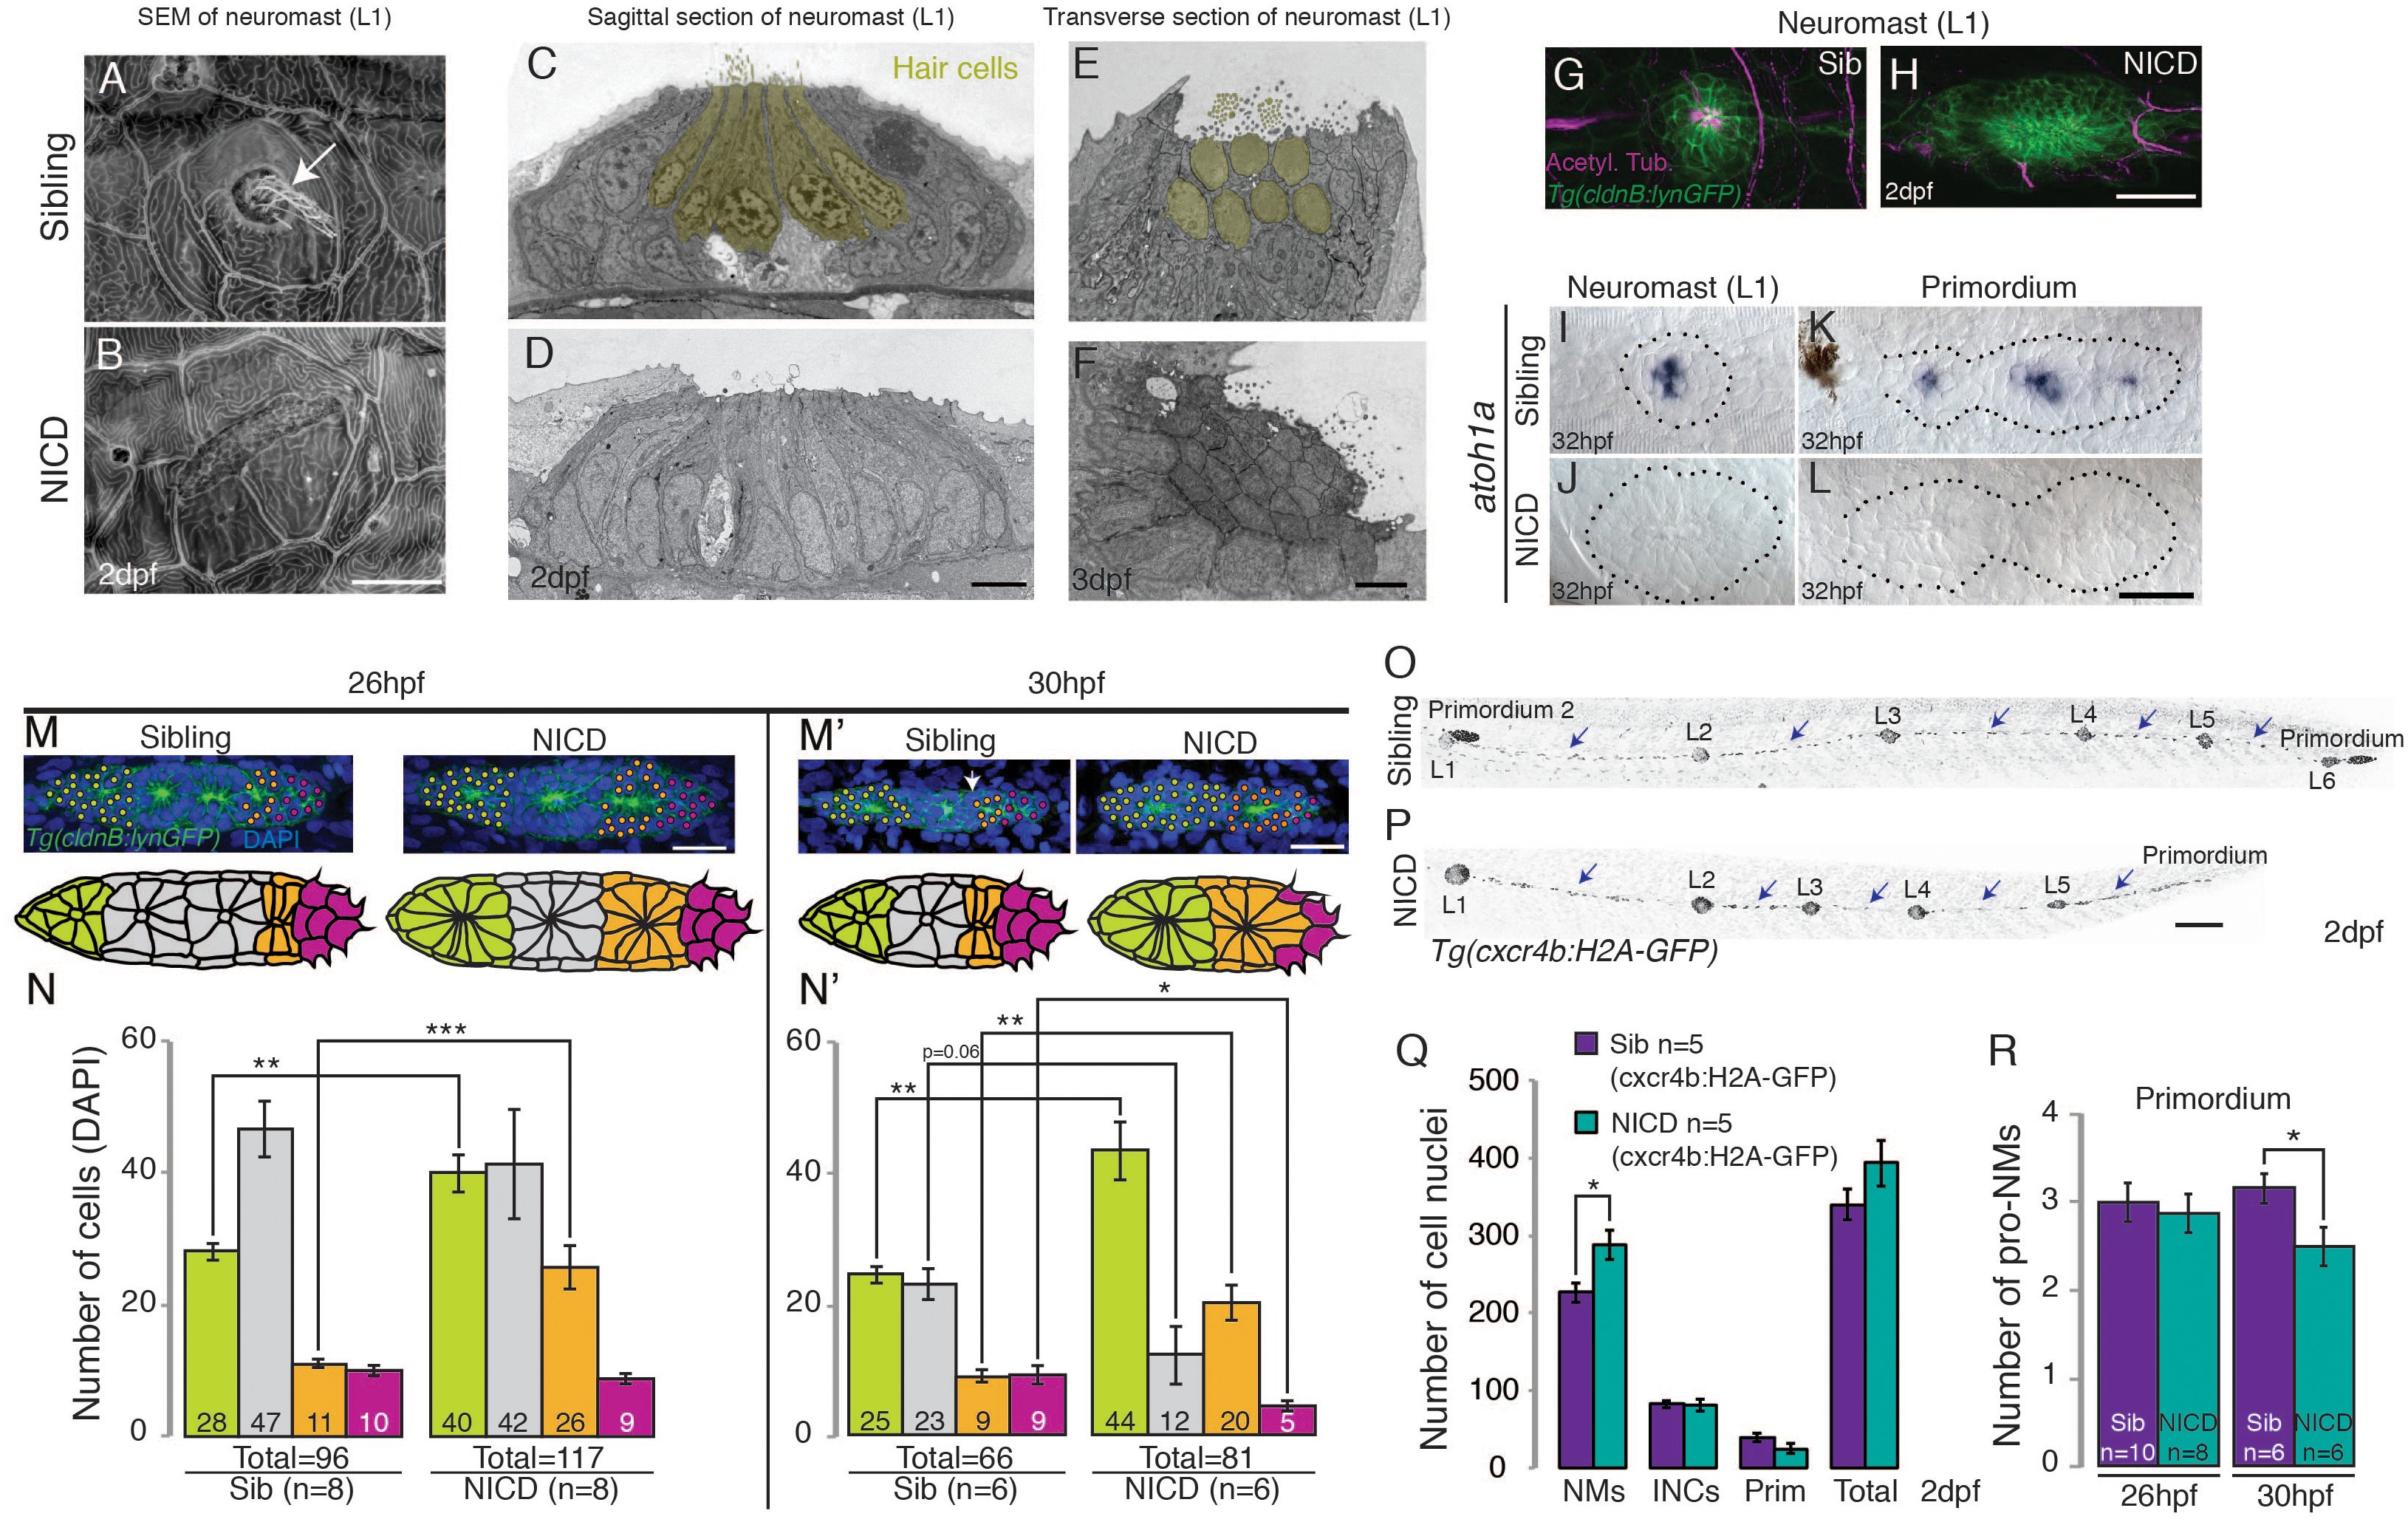
Fig. 4
NICD neuromasts are not larger because of a switch in cell fate.
Scanning electron micrograph of a 2 dpf sibling (A) and NICD neuromast (B) shows that no hair cells (white arrow in WT) are present in the NICD neuromast. Scale bar is 10 μm. (C–F) Transmission electron sections through sibling (C,E) and NICD neuromasts (D,F). (C,E) Hair cells are false colored in yellow. (D,F) No hair cells are present in NICD neuromasts. (C–F) Scale bars are 5 μm. (G and H) Acetylated tubulin antibody stains hair cells in a sibling neuromast (G), but staining is absent in a NICD neuromast (H). (G and H) Scale bar is 25 μm. (I and L) The proneural gene atoh1a is not expressed in NICD neuromasts (J) and the primordium (L). (I–L) Scale bar is 25 μm. (M–N') Cell number (DAPI counts) in the different parts of the primordium. Magenta indicates mesenchymal tip cells, orange indicates the first proneuromast and green indicates the about to be deposited proneuromast. The gray cells are calculated by subtracting mesenchymal, first pro-neuromast and last pro-neuromast cell numbers from the total number of cells in the primordium. (M and M') Scale bar equals 25 μm. (O,P) Tg(cxcr4b:H2A-GFP) labels all lateral line nuclei. (Q) NICD neuromasts consist of significantly more cells compared to sibling neuromasts, but there is no difference between the number of interneuromast cells (INCs) or the primordium cells at 2 dpf. (O and P) Scale bar equals 100 μm. (R) Significantly fewer proneuromasts are formed in a NICD primordium at 30 hpf. Error bars represent standard error from one independent experiment (p<0.05=*, p<0.01=**, p<0.001=*** Student's t test).