
|
Fig. 3
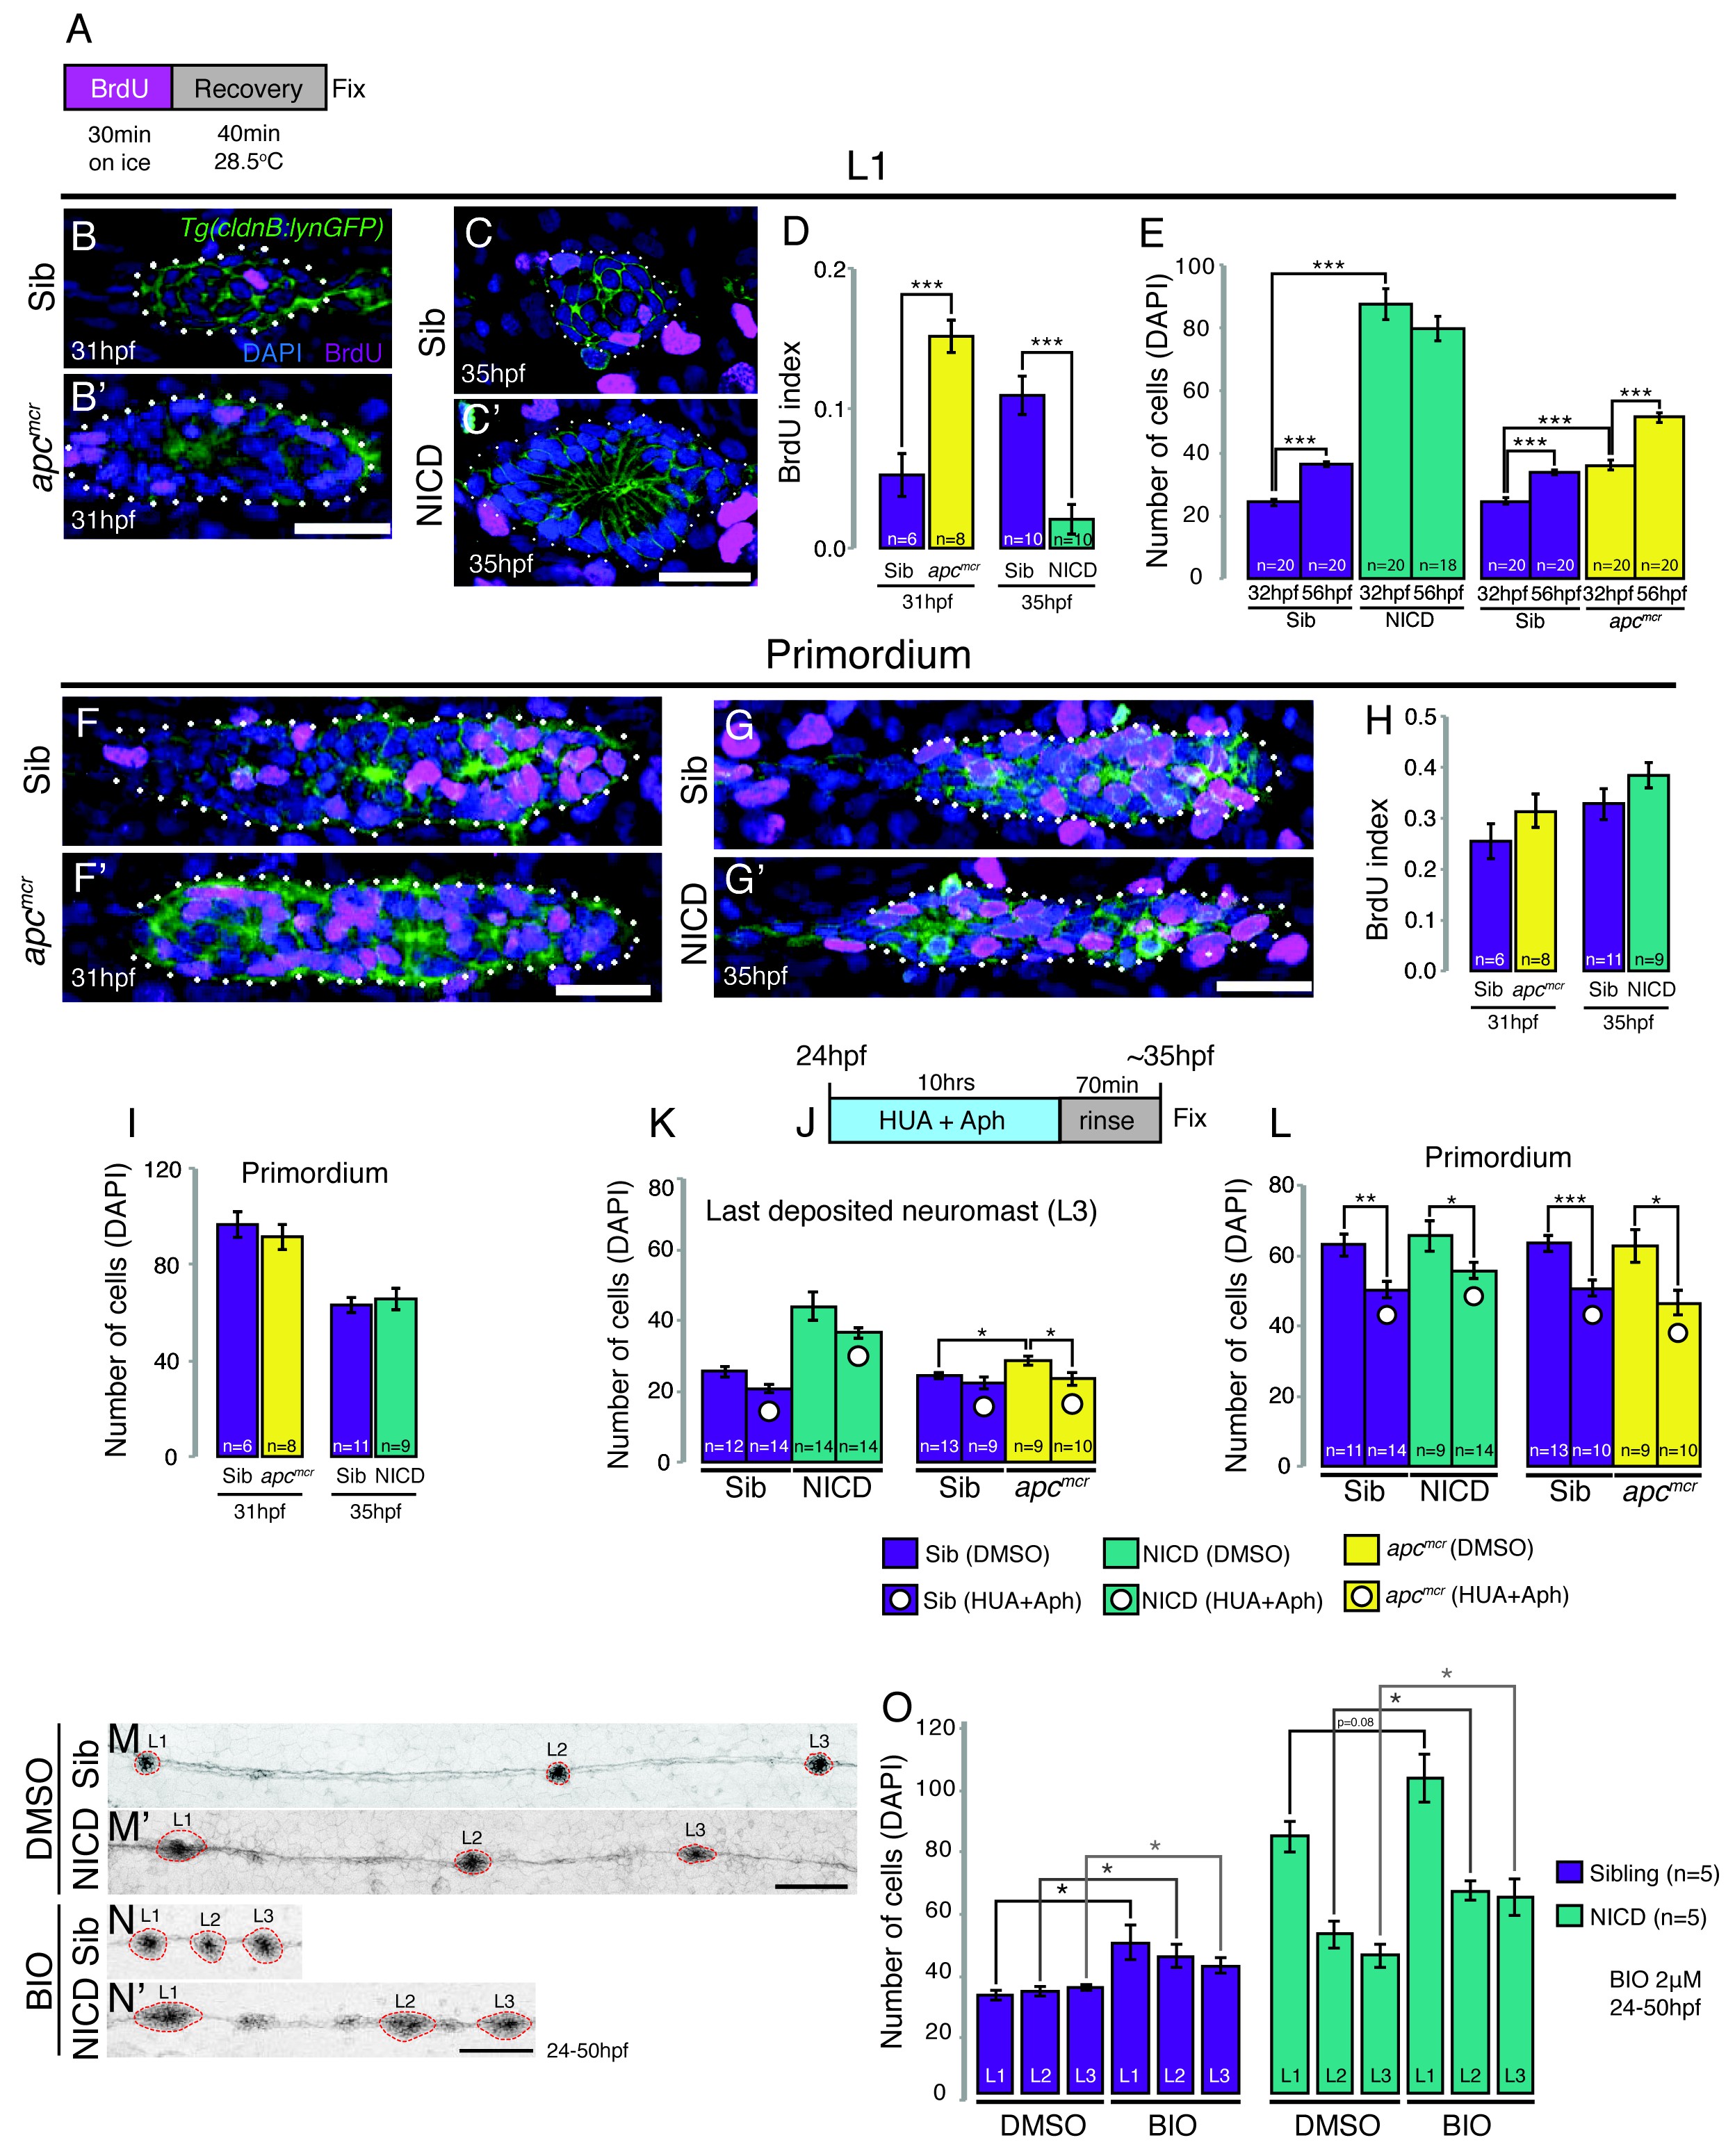
Proliferation is not responsible for large neuromasts in NICD embryos.
(A) BrdU treatment strategy. (B–C') Representative images of BrdU-positive nuclei in L1 apcmcr (B') and NICD neuromasts (C'). (B and B' and D) The BrdU index is increased in apcmcr L1 neuromasts and significantly reduced in NICD L1 neuromasts (C and C' and D). (E) Nevertheless, the number of cells is significantly higher in the apcmcr and NICD L1 neuromasts. While the apcmcr neuromast grows overtime, the NICD neuromast size does not significantly change from 32 hpf to 56 hpf. (F–G') Representative images of BrdU positive nuclei in apcmcr (F') and (G') NICD primordia. (F–H) There is no significant difference in the BrdU index (H) or the number of cells (I) between sibling and apcmcr or sibling and NICD primordia. (J) Hyroxyurea and aphidicolin treatment strategy. (K) Cell cycle inhibition with hydroxyurea and aphidicolin significantly reduces the number of DAPI- positive cells in the last deposited neuromasts in apcmcr embryos. There is no significant reduction in sibling or NICD neuromast sizes after cell cycle inhibition. (L) Cell cycle inhibition significantly reduces the number of cells in sibling, apcmcr and NICD primordia. Scale bars are 25 μm. Treatment of sibling and NICD embryos with the GSK3β inhibitor BIO causes significant enlargement of neuromasts (L1–3). Scale bar is 100 μm. Error bars represent standard error from one independent experiment (p<0.05=*, p<0.01=**, p<0.001=*** Student's t test).