
|
Fig. 1
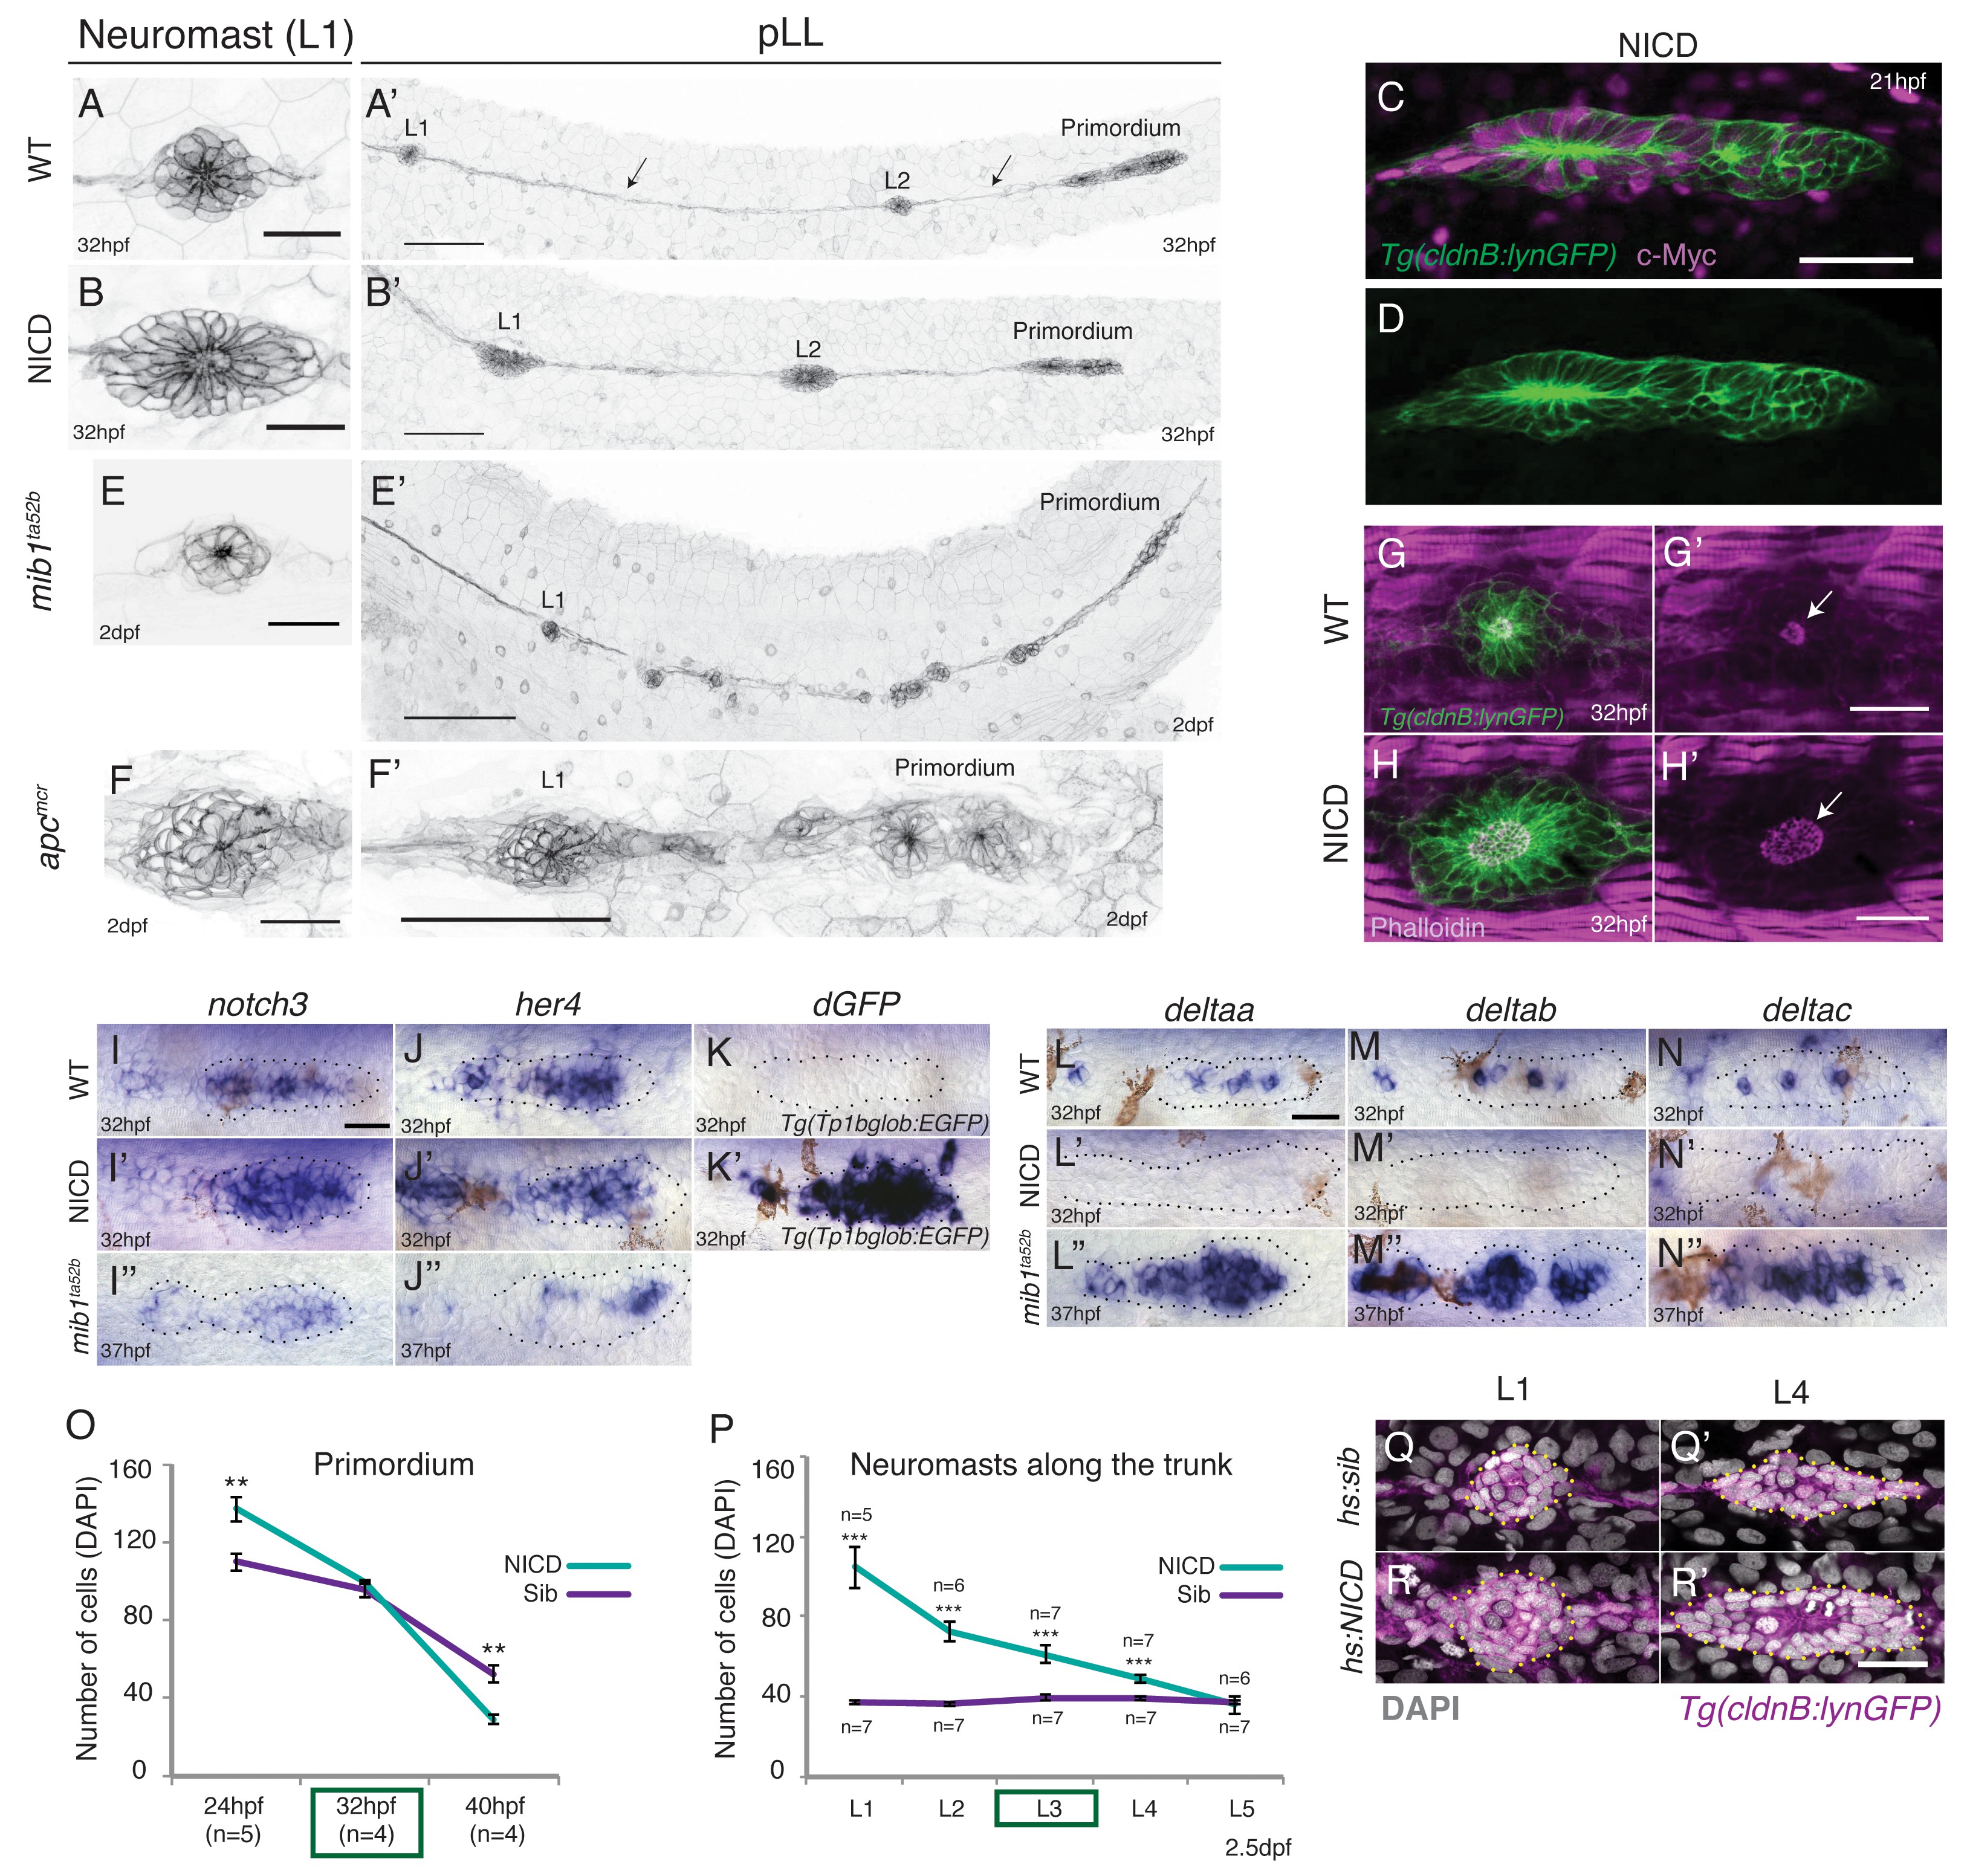
Induction of Notch signaling induces larger lateral line organs.
(A and B and E and F) First deposited trunk neuromasts (L1) in Tg(cldnB:lynGFP). (B) NICD and (F) apcmcr neuromasts are larger than (A) WT and (E) mib1ta52b neuromasts. Scale bar is 25 μm. (A' and B' and E' and F') Posterior lateral line in Tg(cldnB:lynGFP). (A') WT, (B') NICD, (E') mib1ta52b and (F') apcmcr. Scale bar is 100 μm. (C and D) NICD transgenic embryos are labeled by a Myc-tag. The c-Myc antibody in magenta. Scale bar is 50 μm. (G–H') L1 neuromasts stained with Phalloidin at 32 hpf. In NICD neuromasts (H and H') the apical F-actin meshwork (arrow) is larger compared to wildtype (WT) (G and G'), suggesting that NICD neuromasts are composed of more apically constricted cells. Scale bar is 25 μm. (I–N'') Expression of Notch pathway genes in the primordium. (I') notch3, (J') her4 and dgfp in the Notch reporter Tg(Tp1bglob:EGFP) (K') are upregulated in NICD primordia compared to WT (I and J and K) and mib1ta52b (I'' and J'') primordia. The Notch reporter only seems to be activated by high levels of Notch signaling, as it is not active in wildtype primordia (K), even though the Notch target her4 is expressed (J). Scale bar is 25 μm. (L–N'') Expression of delta ligands in the primordium. (L') deltaa, (M') deltab and deltac (N') are largely downregulated in NICD compared to WT (L and M and N) and mib1ta52b (L'' and M'' and N'') primordia. Scale bar is 25 μm. (O) NICD and sibling primordia sizes decrease overtime. NICD primordia start out (24 hpf) with significantly more cells compared to sibling primordia, but after the second deposition cycle at ~32 hpf NICD and sibling primordia have a similar amount of cells. By 40 hpf NICD primordia are composed of significantly less cells. Error bars represent standard error (p<0.01=** Student's t test). (P) NICD neuromasts (L1-4) along the trunk of the embryo at 2.5 dpf consist of significantly more cells compared to siblings. NICD primordia deposit big neuromasts, even at 32 hpf when NICD and sibling primordia possess the same cell number (time point (32 hpf) is marked in the (O) green box, also see L3 deposition in the Video 3). Error bars indicate standard error (p<0.001=*** Student's t test). (Q–R') Notch activation in hs:NICD embryos after the primordium and ganglion have separated still significantly increases neuromast sizes (R') compared to a (Q') sibling (see Figure 1—figure supplement 1E for quantification). These results indicate that the number of cells in neuromasts is independent of primordium size. Notch overexpression was induced by a 39°C heat-shock for 45 min starting at 25 hpf (L1 was still a part of the primordium). Embryos were fixed after L4, L5 deposition (~40 hpf). Scale bar is 25 μm.