
|
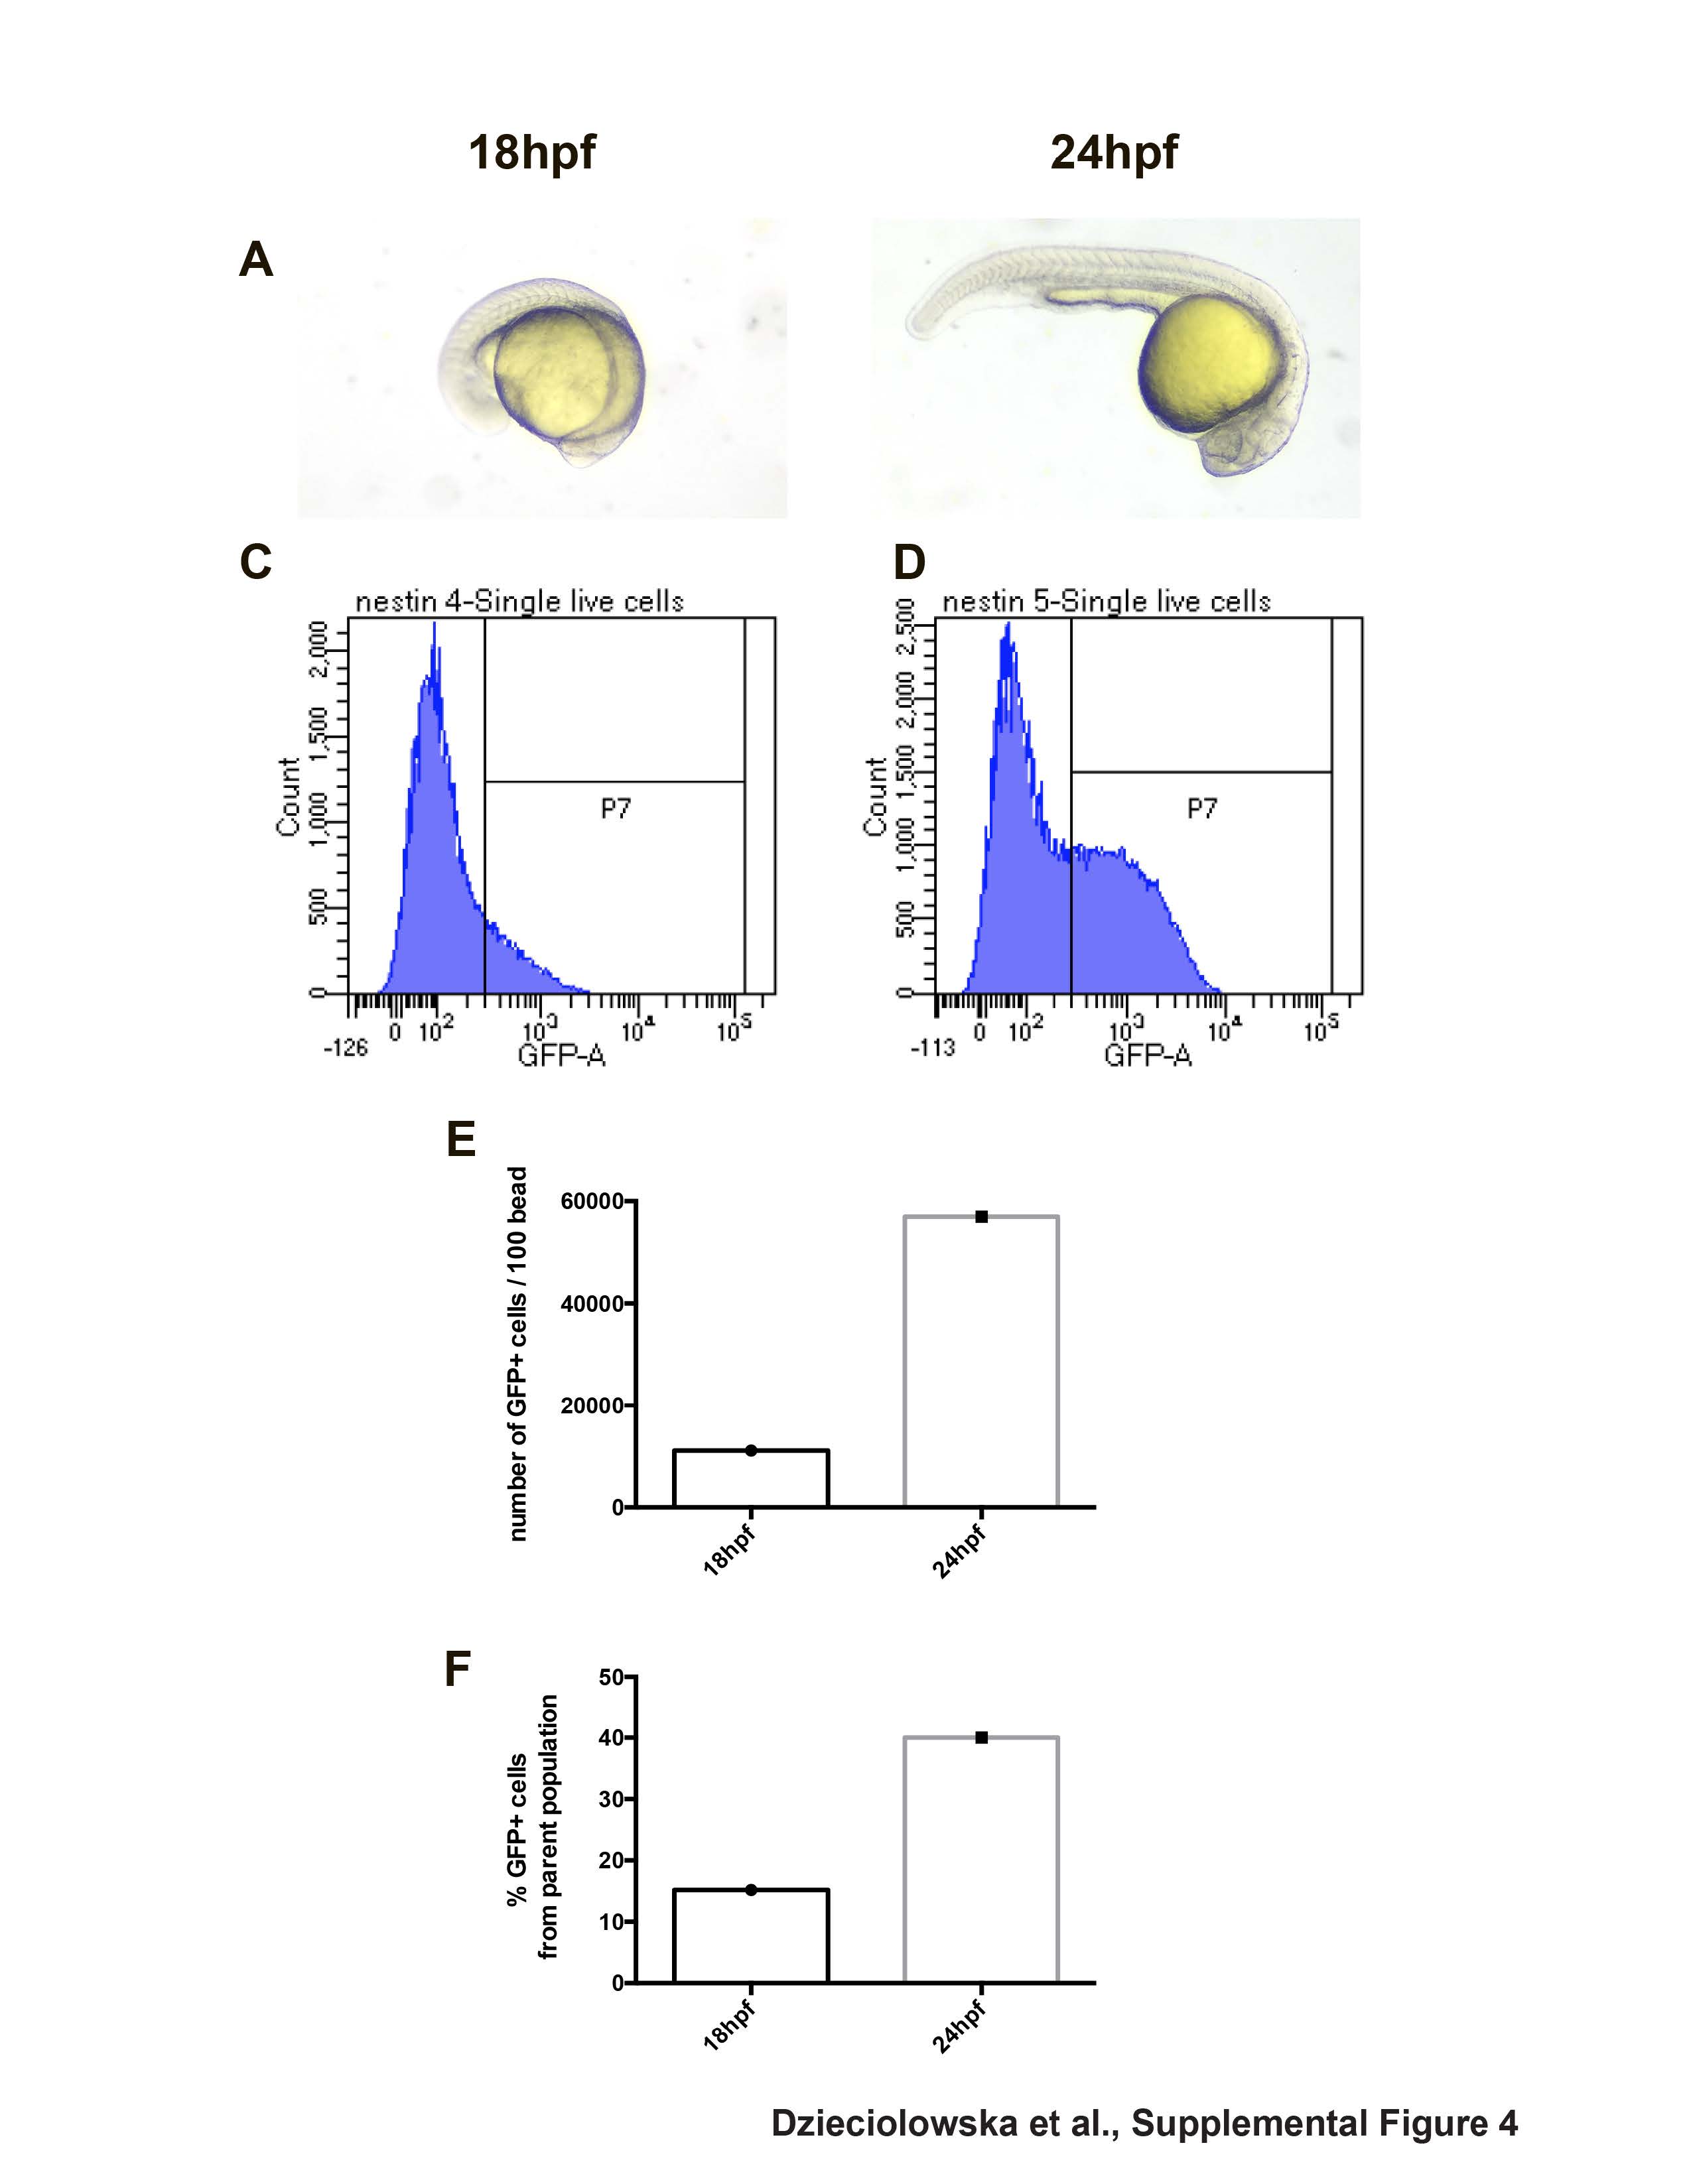
Fig. S4
nestin+ population quantification from 18 hpf versus 24 hpf embryos.
(A) Bright field image of 18 and 24 hpf embryo. (B, C) The GFP+ cell population (e.g.[nestin:GFP]) was distinguishable using a 488 nm laser with a 530/30 BP filter (population labeled P7). The fluorescent beads were distinguishable using a 561 nm laser with a 610/20 BP filter and a 405 nm laser with a 525/50 BP filter. (E) The number of nestin+ cells counted per 100 beads increases by a factor of 3 in 24 hpf embryos compared to 18 hpf embryos (F) The same results presented as a percentage of GFP+ cells/parent population also show an increase in the number of GFP+ cells at 24 hpf. (N=1, n=25 embryos)