
|
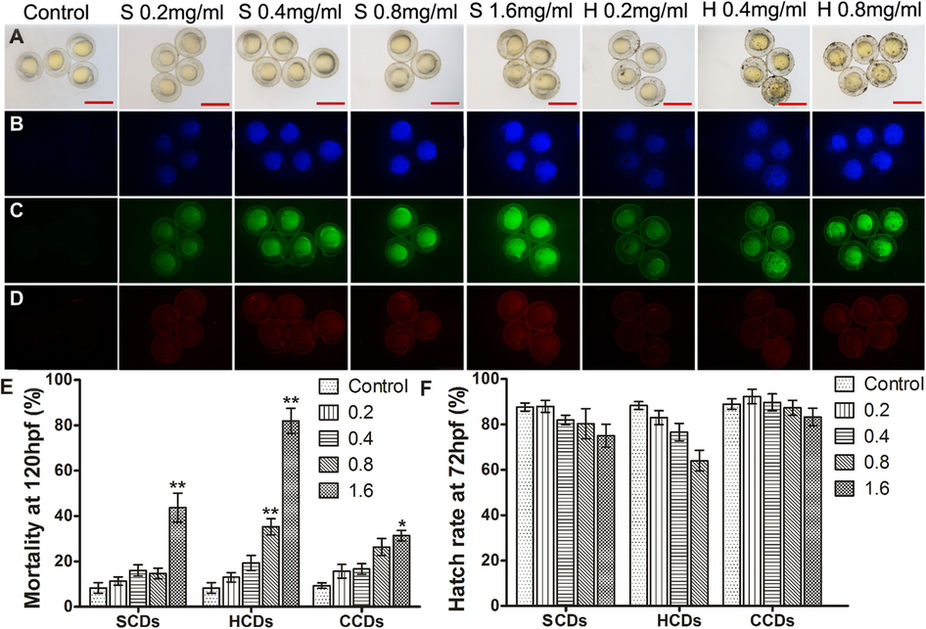
Fig. 4
The fluorescent imaging of CDs in zebrafish and biocompatibility of CDs.
(A–D) Fluorescent microscopic images of bright field and fluorescent field (B blue, C green, and D red) of zebrafish embryos at 24 hpf after exposure to different concentrations of SCDs and HCDs. Scale bars, 1000 μm. (E,F) Effects of exposure concentration of SCDs, HCDs and CCDs on zebrafish mortality at 120 hpf and hatch rate at 72 hpf (n = 50). Single asterisk (*) indicated significant difference compared to control at P < 0.05, and double asterisks (**) indicated significant difference, compared to control at P < 0.01. Values represented the mean ± standard error (SE) of three replicates.