
Image
|
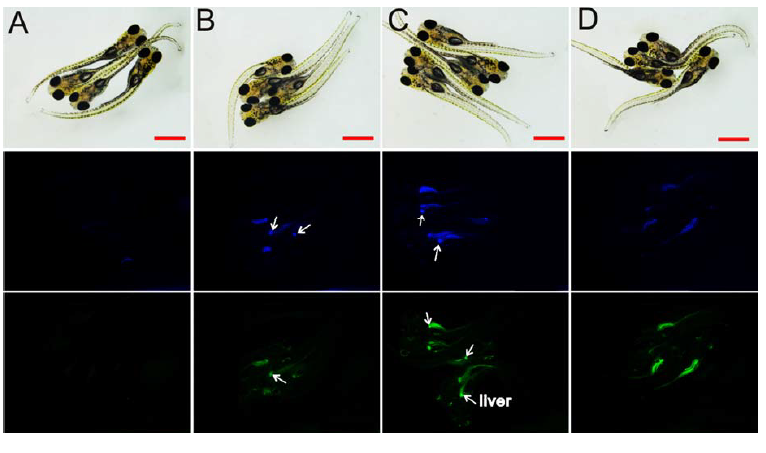
Figure Caption
Fig. S4
Biocompatibility detection of CDs in zebrafish embryos at 10 dpf.
Fluorescent microscopic images were captured in bright field (upper row) and fluorescent field (middle row and lower row) after embryos exposure to CDs for 2 d. (A) control; (B) HCDs; (C) SCDs; (D) CCDs. Scale bars, 1000 μm.
Acknowledgments
This image is the copyrighted work of the attributed author or publisher, and
ZFIN has permission only to display this image to its users.
Additional permissions should be obtained from the applicable author or publisher of the image.
Full text @ Sci. Rep.