
|
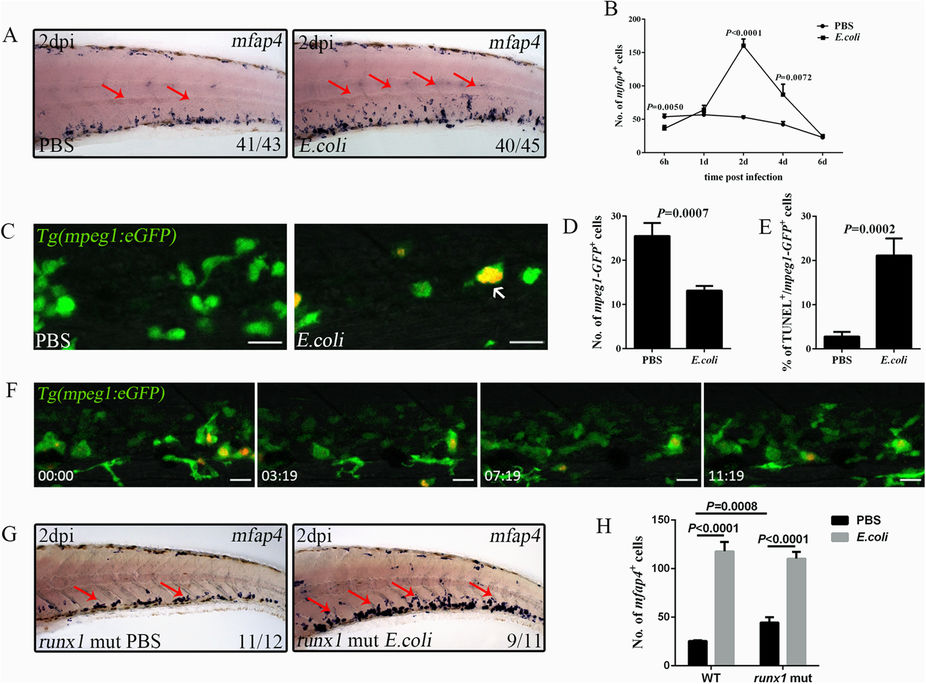
Fig. 4
Emergency monopoiesis occurs upon intravenous E. coli (5–10 × 103 cfu) infection.
(A), WISH of mfap4 (red arrows) in the CHT of a larva treated with PBS or E. coli at 2 dpi (4 dpf). (B), The data obtained for mfap4+ macrophages at different time points after challenge (36.13 ± 4.52 vs 53.88 ± 3.90; 64.25 ± 6.58 vs 57.00 ± 3.29; 160.44 ± 9.92 vs 53.20 ± 1.90; 87.00 ± 15.67 vs 42.44 ± 4.21; 24.71 ± 2.14 vs 23.00 ± 2.30 in E. coli vs PBS group at each time point. N ≥ 8 in each group). (C,D), Fluorescence images (C) and calculation (D) of mpeg1-GFP+ macrophages in PBS (25.50 ± 2.94; N = 8) or E. coli (13.13 ± 1.09; N = 8) treated larval CHT at 6 hpi. The red signals indicate the bacteria phagocytosed by mpeg1-GFP+ macrophages (white arrows). (E), The percentage of mpeg1-GFP+ macrophages that co-stained with TUNEL at 6 hpi (21.13 ± 3.86 vs 2.82 ± 1.05 in E. coli vs PBS group. N ≥ 10 in each group). (F), Time-lapse imaging of an infected Tg(mpeg1:eGFP) CHT from 1 dpi to 1.5 dpi (see also Video S5). (G-H), WISH (G) and calculation data (H) for mfap4+ macrophages (red arrows) in the runx1 mutant treated with either PBS or E. coli at 2 dpi (4 dpf) (WT: 117.9 ± 9.63 vs 25.38 ± 0.96 E. coli vs PBS; runx1 mut: 110.3 ± 6.88 vs 44.40 ± 5.72 E. coli vs PBS; N ≥ 5 in each group). Scale bars, 20 μm.