
|
Fig. 3
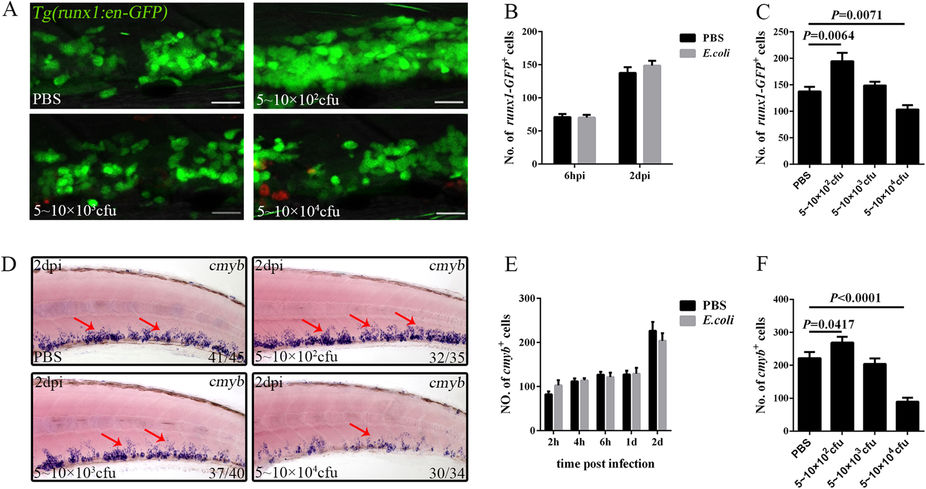
Reaction of HSPCs to different E. coli burdens after intravenous injection.
(A), Fluorescence images showing the runx1-GFP+ cells in Tg(runx1:en-GFP) larvae treated with different volumes of E. coli at 2 dpi (4 dpf). Scale bars, 20 μm. (B), The number of runx1-GFP+ cells in larvae treated with 5–10 × 103 cfu E. coli or PBS. (70.31 ± 4.18 vs 71.14 ± 4.42; 148.8 ± 7.14 vs 137.6 ± 8.65 in E. coli vs PBS group at each time points. N ≥ 7 in each group). (C), Calculation of the runx1-GFP+ cells in (A) (137.6 ± 8.65; 194.6 ± 15.63; 148.8 ± 7.14; 103.4 ± 8.38 in each group. N ≥ 8 in each group). (D), WISH of cmyb (red arrows) in the larval CHT treated with different volumes of E. coli at 2 dpi (4 dpf). (E), The data obtained for cmyb+ cells at different time points after treatment with 5–10 × 103 cfu E. coli or PBS (102.80 ± 11.67 vs 82.40 ± 6.59; 114.00 ± 4.97 vs 112.00 ± 6.60; 121.60 ± 9.70 vs 127.00 ± 6.69; 129.00 ± 13.71 vs 127.60 ± 8.20; 203.80 ± 17.06 vs 226.40 ± 20.07 in E. coli vs PBS group at each time point. N = 8 in each group). (F), Calculation of the cmyb+ cells in (D) (221.60 ± 18.56; 268.70 ± 17.77; 203.80 ± 17.06; 89.30 ± 12.54 in each group. N = 10 in each group).