
Image
|
Figure Caption
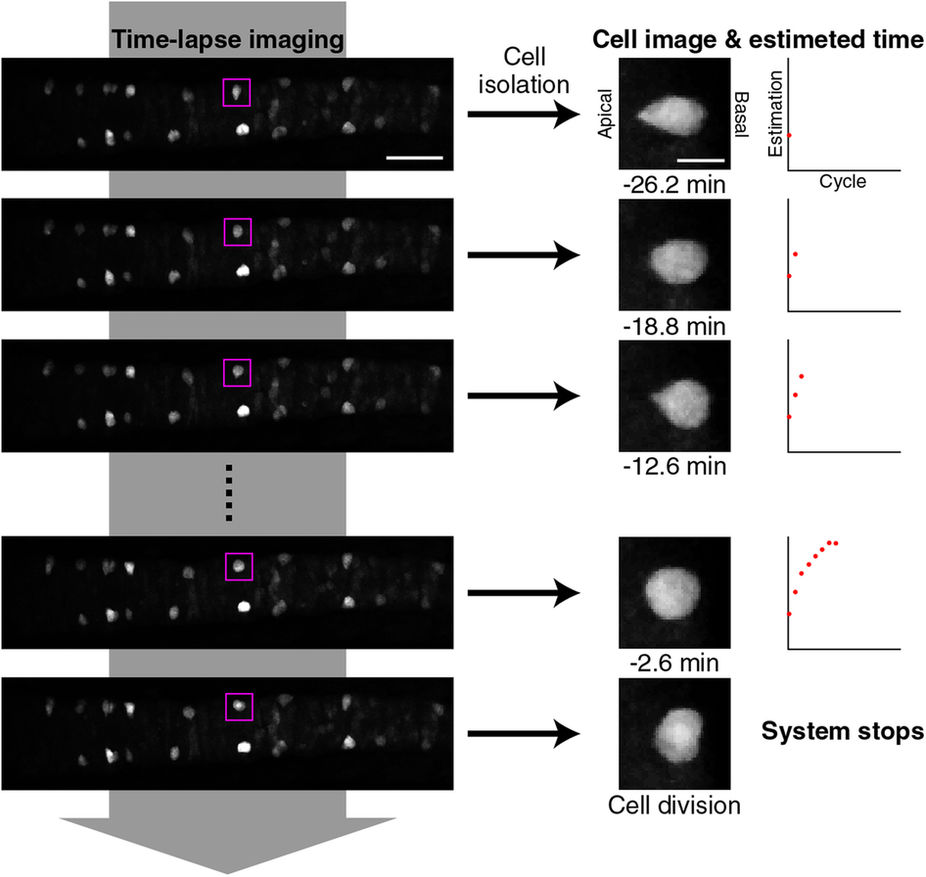
Fig. 6
Real-time prediction system.
The method of real-time prediction is schematically shown. Here, the successive shape changes of the boxed GFP+ V2 cell (the left and middle columns) were tracked at 2.5 min intervals (middle column) and the remaining time to division was predicted using sequential Bayesian inference and plotted as dots (right column). See also “Real-time prediction of cell-division timing” section of Methods. Scale bars, 50 μm and 10 μm for the left and middle columns, respectively.
Acknowledgments
This image is the copyrighted work of the attributed author or publisher, and
ZFIN has permission only to display this image to its users.
Additional permissions should be obtained from the applicable author or publisher of the image.
Full text @ Sci. Rep.