
|
Fig. 5
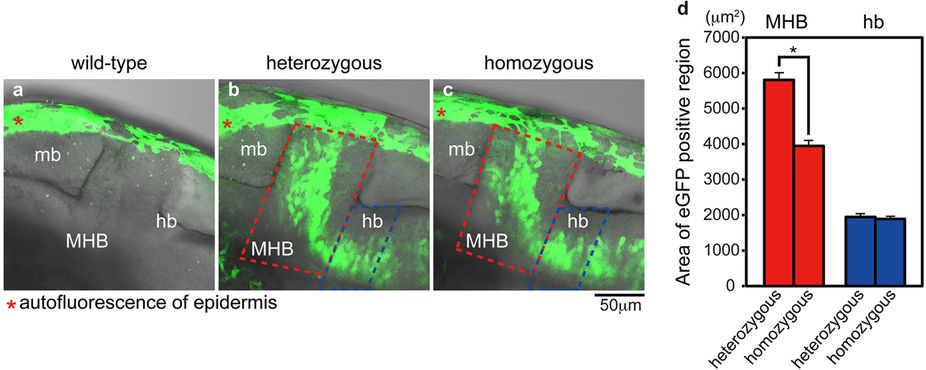
Functional analysis of Tg[epdr1-hs:eGFP].
(a) Autofluorescence of epidermis in wild-type embryo (red asterisk). (b,c) The distribution of eGFP-positive cells in the midbrain (mb) and the hindbrain (hb) of heterozygous (b) and homozygous (c) Tg[epdr1-hs:eGFP] embryos at 30 hpf (lateral view, anterior left) (confocal images). Autofluorescence in epidermis is indicated by red asterisk. (d) The area of eGFP-positive cells of heterozygous and homozygous Tg[epdr1-hs:eGFP] embryos in the MHB (red dashed line) and anterior part of hindbrain (blue dashed line) in the visual field (N = 14 each). Error bars indicate standard error of the mean (SEM). Statistical significance was determined using Student’s t-test. *P < 0.05.