
|
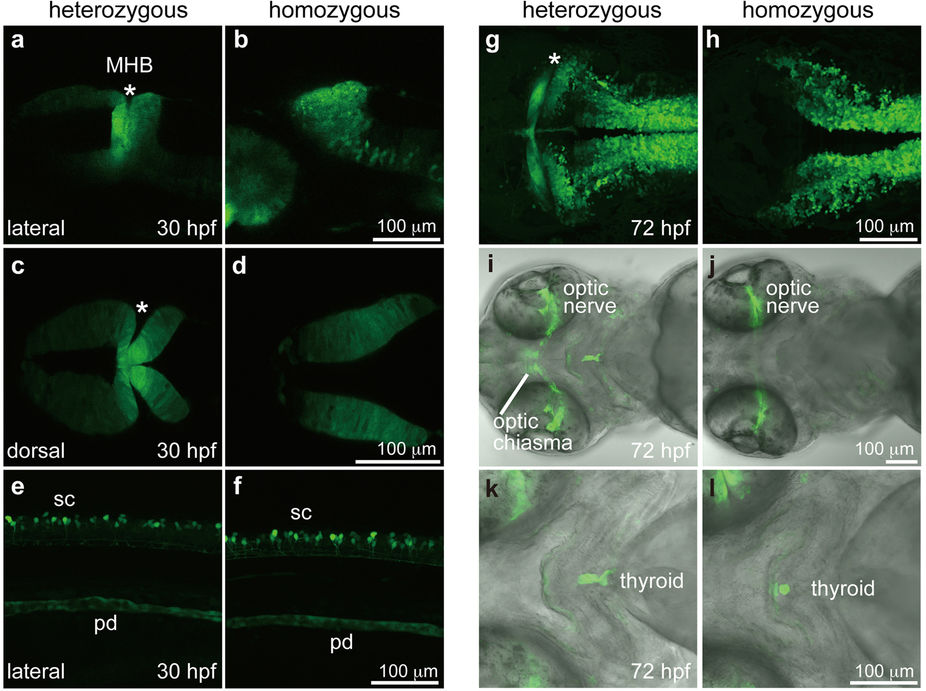
Fig. 3
eGFP expression visualized by the endogenous pax2a enhancer activity.
(a,c) The MHB (asterisk) of a heterozygous Tg[pax2a-hs:eGFP] embryo at 30 hpf. (b,d) The midbrain and hindbrain of a homozygous Tg[pax2a-hs:eGFP] embryo at 30 hpf. (e,f) The spinal cord neurons (sc) and pronephric duct (pd) of heterozygous (e) and homozygous (f) Tg[pax2a-hs:eGFP] embryos at 30 hpf. (g) The MHB of the heterozygous Tg[pax2a-hs:eGFP] embryo at 72 hpf. (h) The midbrain and hindbrain of the homozygous Tg[pax2a-hs:eGFP] embryo at 72 hpf. (i,j) The optic nerves of heterozygous (i) and homozygous (j) Tg[pax2a-hs:eGFP] embryos at 72 hpf. (k,l) The thyroids of heterozygous (k) and homozygous (l) Tg[pax2a-hs:eGFP] embryos at 72 hpf. All data were obtained by confocal microscopy. (a,b,e,f) Genotyping was performed using genomic PCR. Lateral view with anterior to the left and dorsal to the top. (c,d,g,h) Dorsal view with anterior to the left. (i–l) Ventral view with anterior to the left.