
|
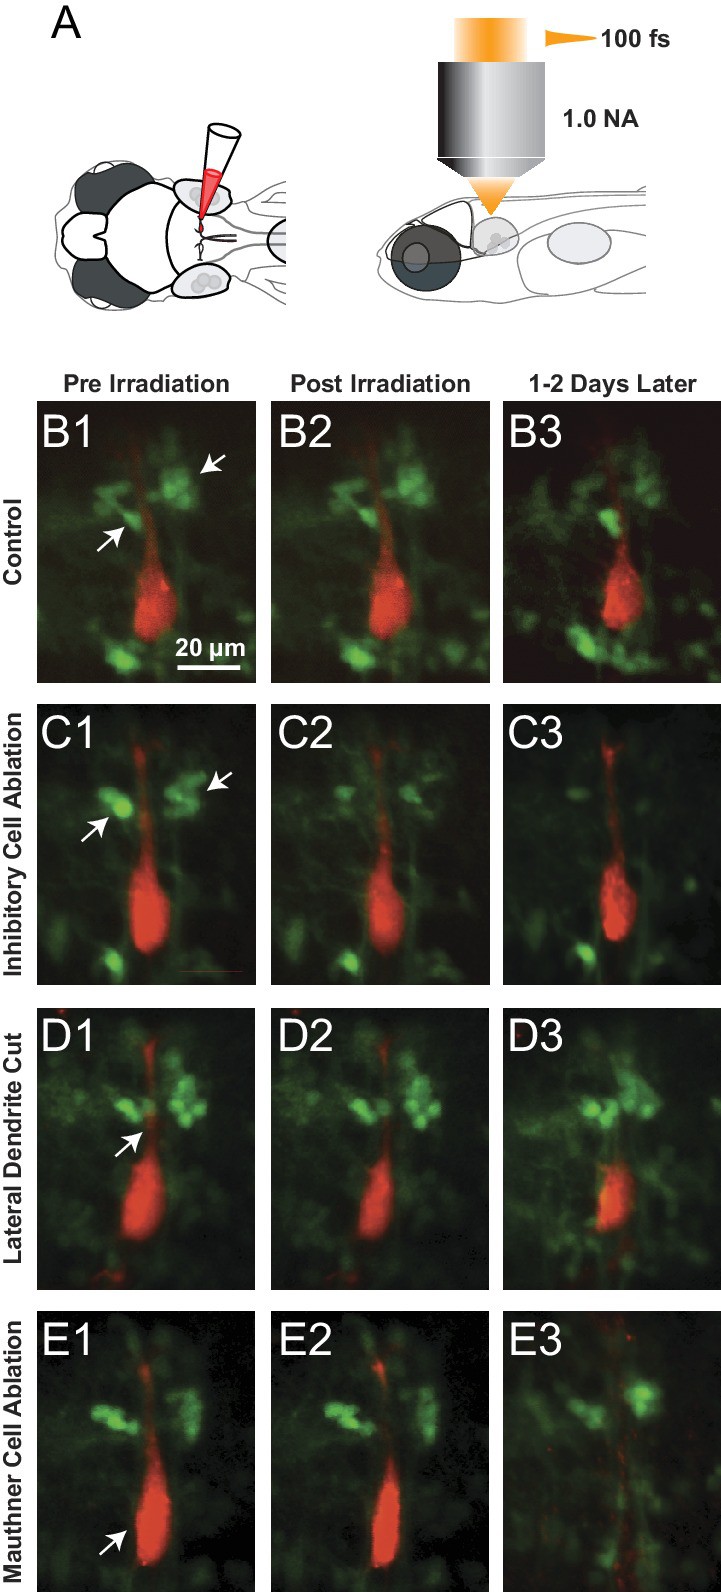
Fig. 7
Examples of Laser ablations.
(A) Diagram showing the approach to ablations, with initial filling of the Mauthner cell with red dye by single cell electroporation in a line with GFP labeled glycinergic neurons, followed by imaging and ablations from above with a femtosecond laser. (B1–B3) Control fish exposed to laser power below threshold for lesions shown pre irradiation (B1), immediately post irradiation (B2) and between 1 and 2 days later (B3). Glycinergic neurons are green, with arrows pointing to the cluster of feedforward cells on either side of the red Mauthner cell. (C1–C3) As in B, but with laser ablation directed at the visible feedforward neurons (arrows in C1), most of which were removed (C3), while preserving the adjacent red dendrite of the M-cell. (D1–D3) Laser targeting of the lateral dendrite of the Mauthner cell (arrow) sometimes severs the lateral dendrite, while leaving the adjacent inhibitory neurons and the soma of the M-cell intact (D3). (E1–E3) Laser targeting of the lateral dendrite that led to death of the M-cell (soma marked by arrowhead in E1 is absent in E3), but preservation of adjacent inhibitory neurons.