
|
Fig. 1
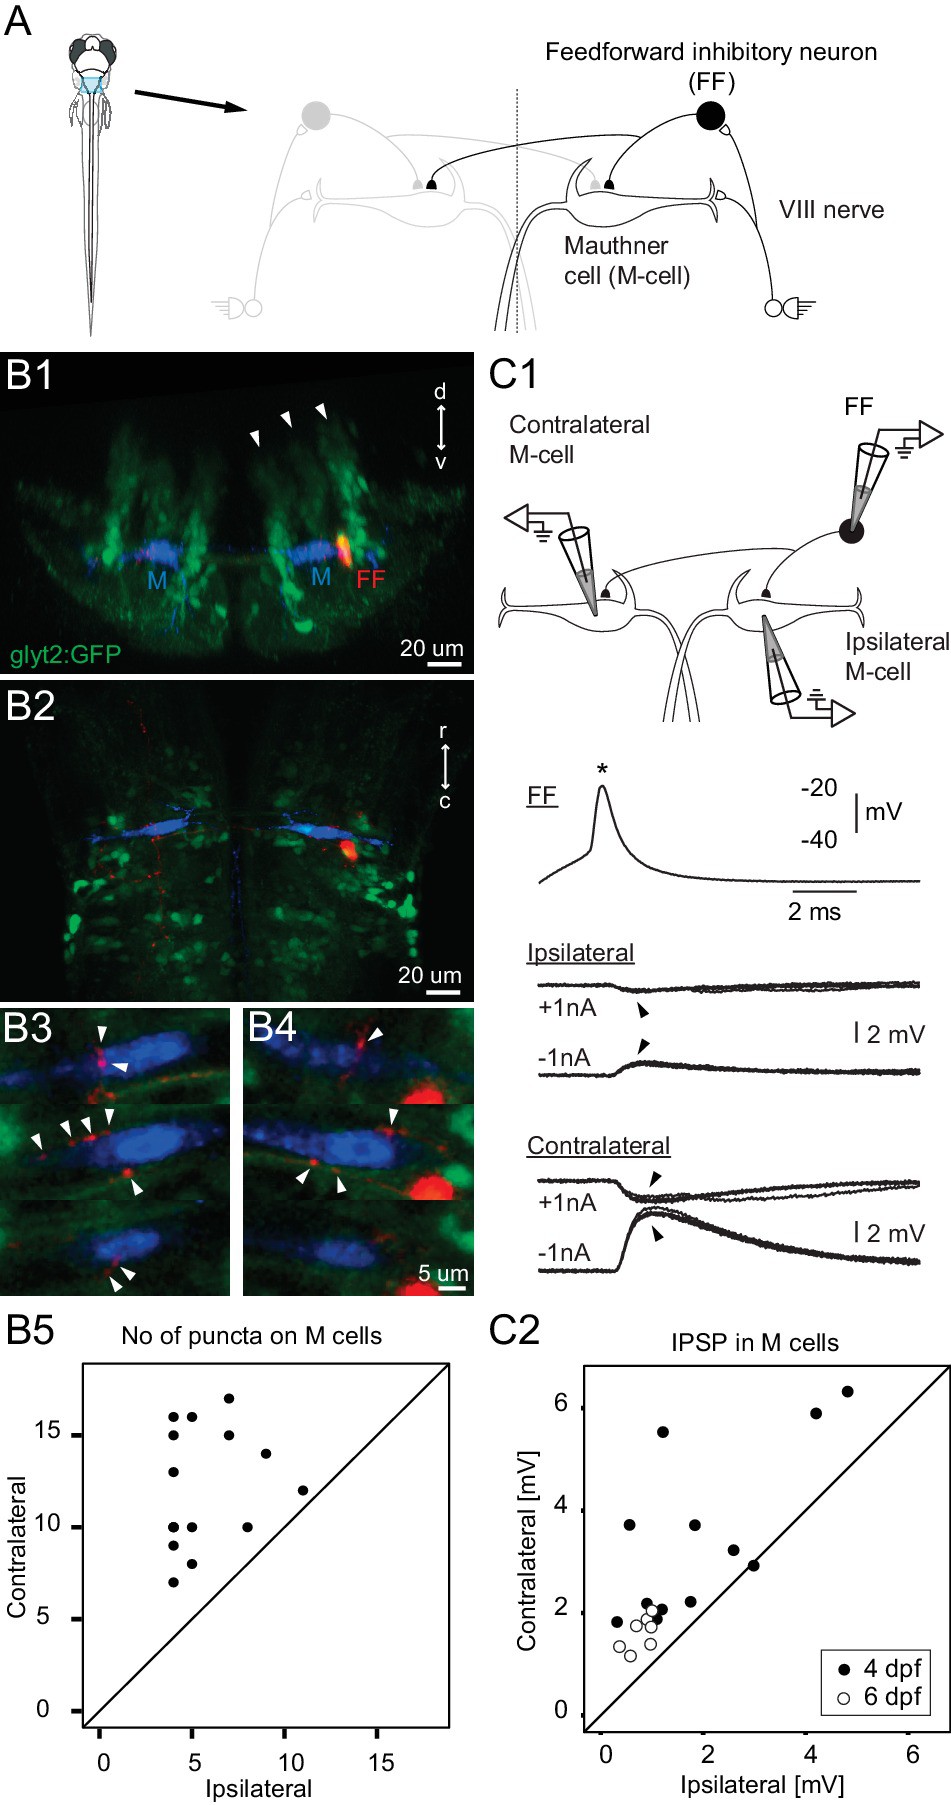
Connectivity of inhibitory neurons implicated in the laterality of the escape response.
(A) The blue region marked on the drawing of the fish contains the two Mauthner cells and neuronal candidates for their control, which may determine whether the animal escapes to the left or right. Right side shows some known contacts in this network, with sensory inputs from the eighth nerve exciting the ipsilateral M-cell as well as inhibitory interneurons that inhibit both M-cells. (B1) A cross section through the hindbrain in the region of the Mauthner cell from a transgenic line with glycinergic neurons labeled with GFP (green). The two Mauthner cells (blue) and a filled feedforward (FF) inhibitory interneuron (red) were labeled via patch pipettes. The FF neuron lies at the bottom of the most lateral of three columns (arrowheads) of glycinergic neurons, near the lateral dendrite of the M-cell. (B2) A horizontal view of the region shows that red processes of the FF neuron are located in the vicinity of both the ipsilateral and contralateral M-cells. Optical sections through the region of the contralateral (B3) and ipsilateral M-cells (B4) show swellings (arrowheads) of the processes from the inhibitory FF cell adjacent to both M-cells. (B5) A plot of the number of boutons adjacent to ipsilateral versus contralateral M-cells from 14 fish (4 days old) in which individual FF cells and both M-cells were labeled. In every case, the number of boutons apposed to the contralateral cell exceeded the number apposed to the ipsilateral one, with a highly significant difference between the two sides (p<0.0001). (C1) Triple patch recordings from an FF neuron and the two M-cells show that firing the FF cell (asterisk) by current injection produces larger IPSPs in the contralateral M-cell than the ipsilateral one (arrowheads). IPSPs from four sweeps are shown at potentials above and below resting potential by the injection of plus or minus 1 nA of current into the M-cells. This electrophysiology is from the neurons whose morphology is shown in B. (C2) A plot of the amplitude of the IPSPs (for negative 1 nA injection) in the ipsilateral versus contralateral M-cell from 19 triple patch experiments like the one in C1. Seven of these were from 6 days old nacre fish and 12 from 4 days old relaxed fish. In 18 of 19 experiments, the IPSPs were larger in the contralateral M-cell, with a highly significant difference between the two sides (p<0.001).