
|
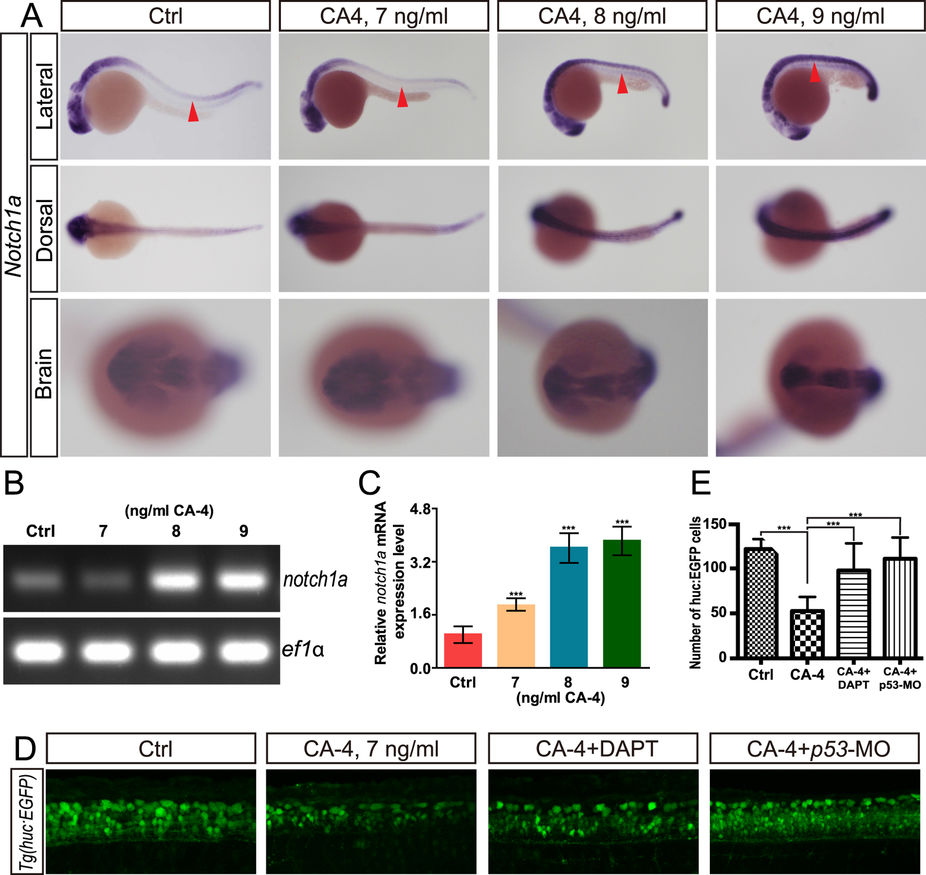
Fig. 7
CA-4 treatment caused norch1a up regulation.
(A) Whole-mount in situ hybridization analysis of notch1a expression in control embryo and CA-4-treated embryo. Red arrowhead indicates neural tube. (B) RT-PCR analysis of notch1a expression in control embryo and CA-4-treated embryo. (C) Real-time PCR analysis of notch1a expression in control embryo and CA-4-treated embryo. (D) Confocal analysis of CA-4-treated Tg (huc:EGFP) embryo. (E) Statistical analyses of EGFP positive cells in central nervous system of control, CA-4-treated, CA-4 and DAPT treated, and CA-4 treated p53 knockdown embryo. (n = 6), ***P < 0.001.