
|
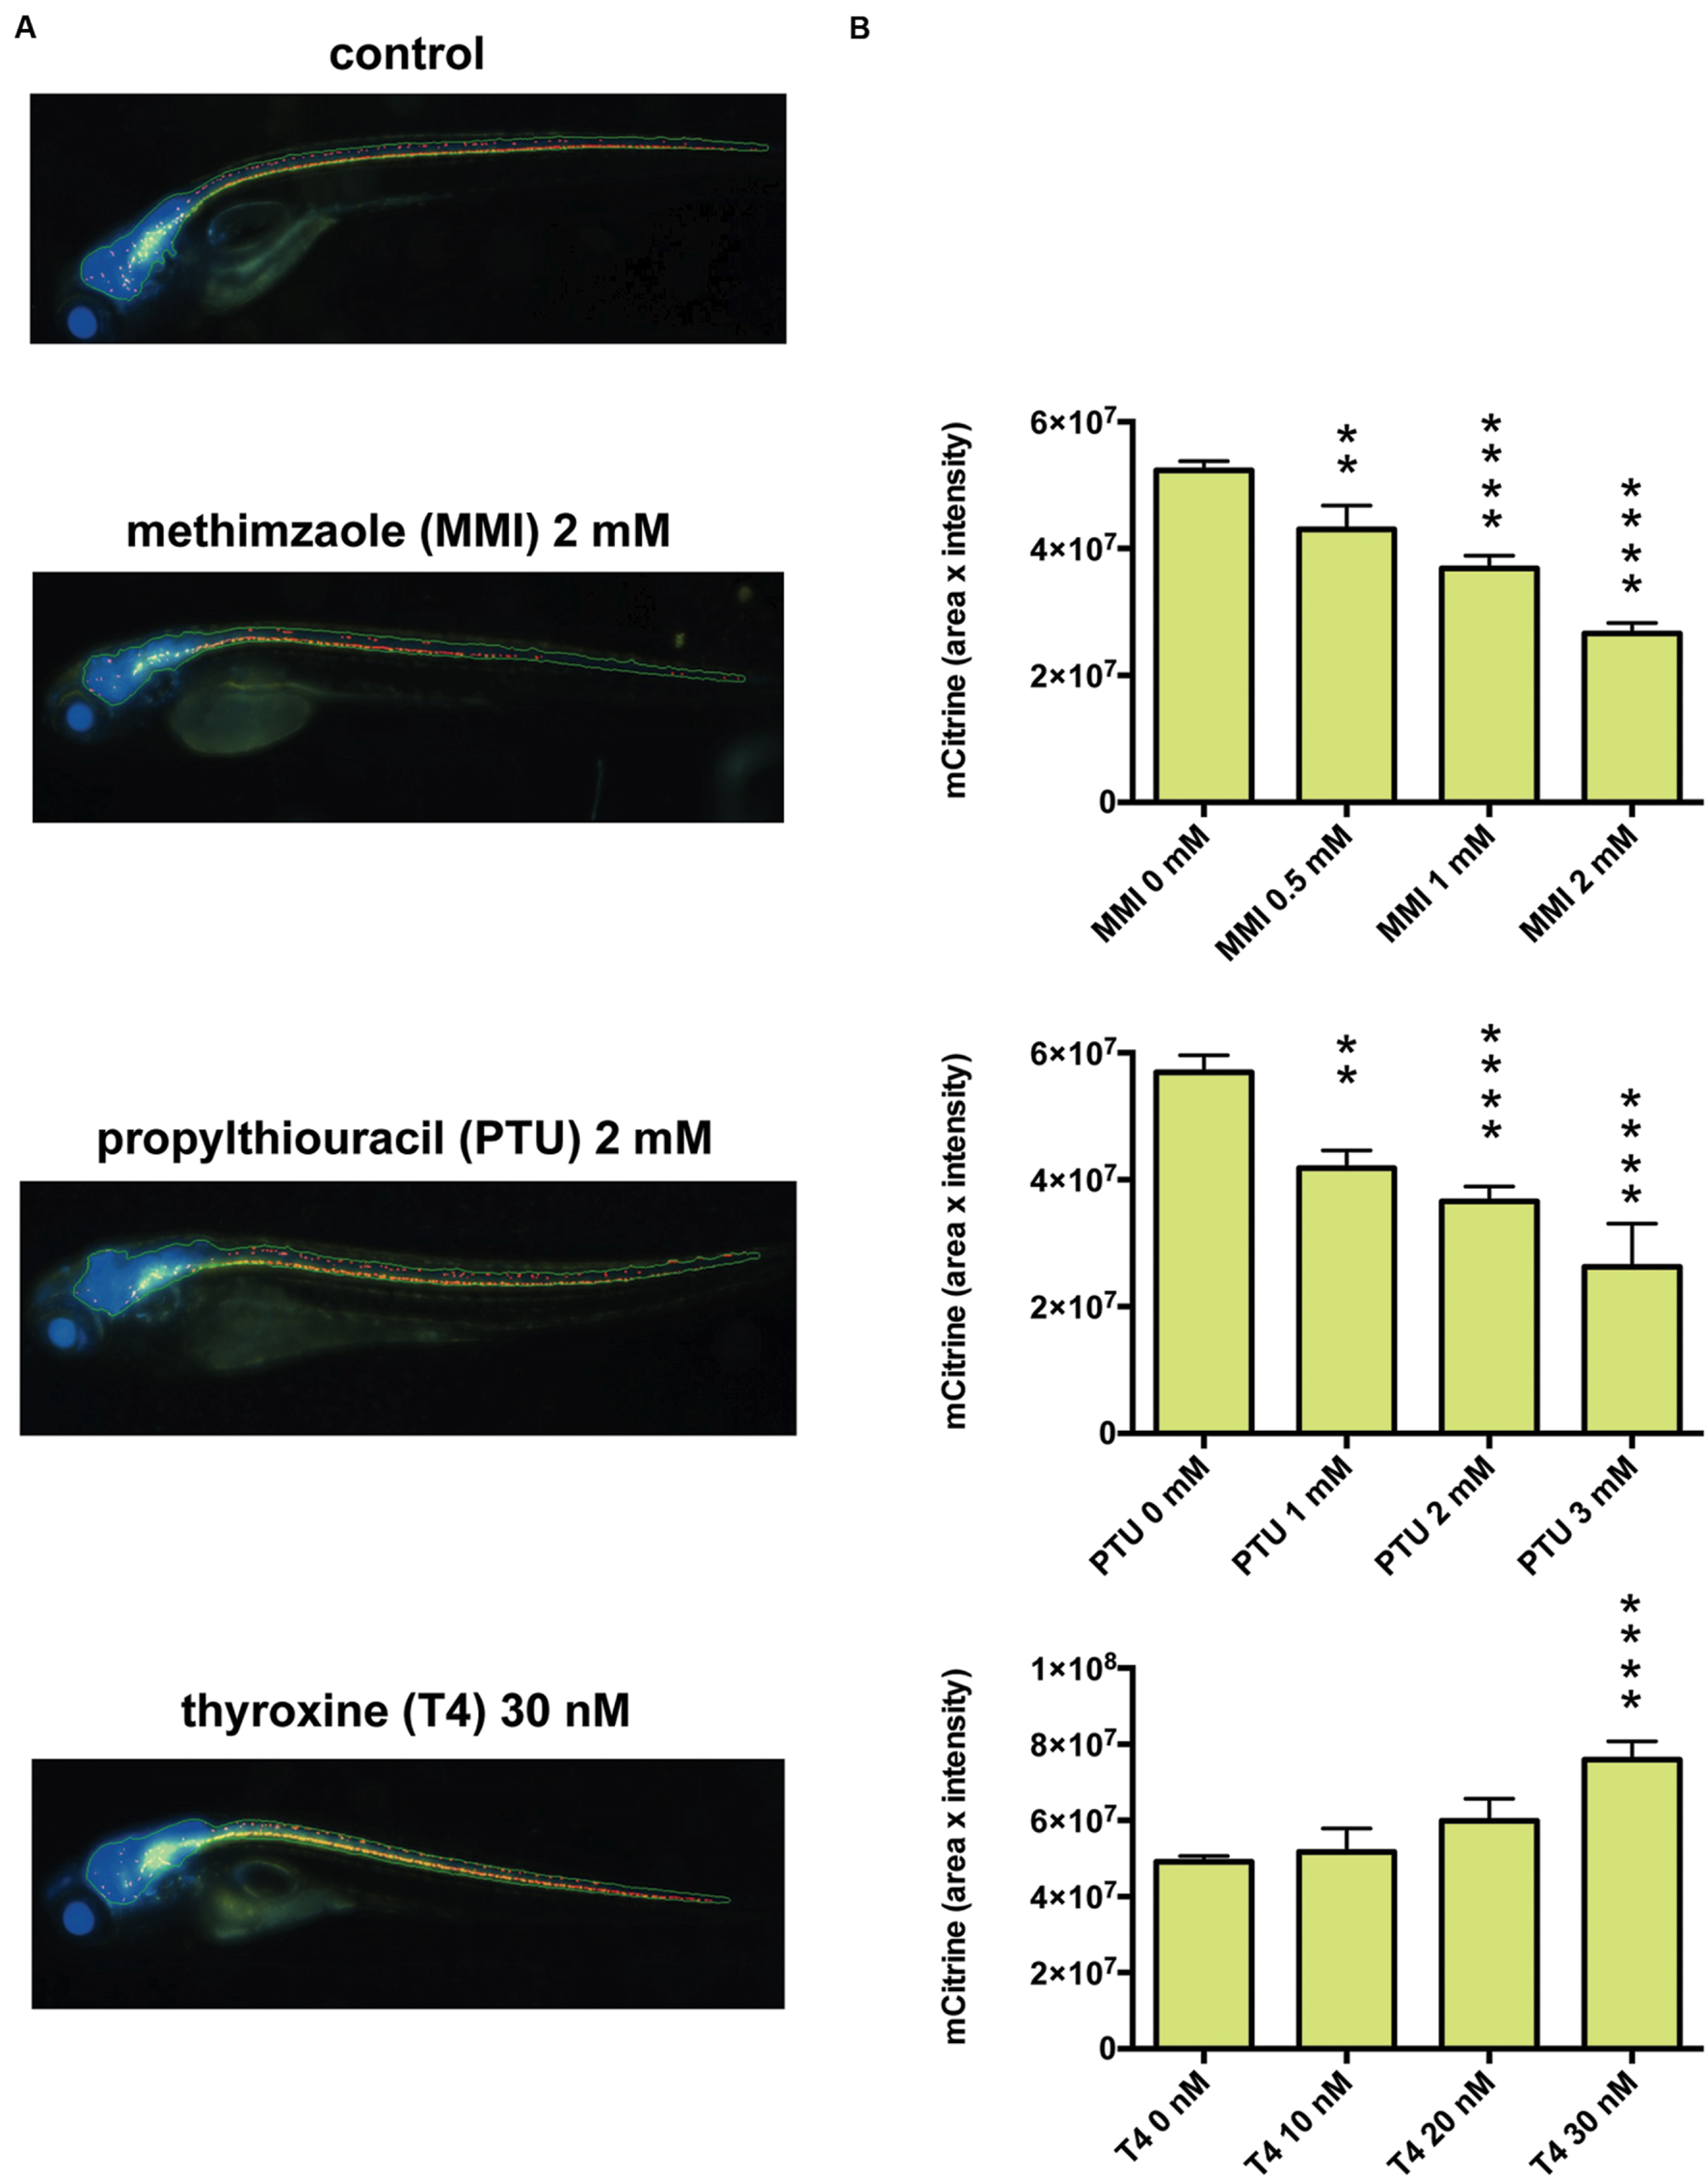
Fig. 4
Effects of thyroid hormone modulators on mbp promoter-driven fluorescence in zebrafish. (A) Representative images from in vivo analysis of Tg (mbp: mCitrine, eno2: Cerulean) zebrafish incubated with or without the indicated concentrations of methimazole (MMI), propylthiouracil (PTU), or thyroxine (T4). (B) Quantification of mCitrine fluorescence intensity within the area of Cerulean fluorescence. (Top) Zebrafish were untreated (n = 40) or treated with MMI (n = 16 for 0.5 mM, n = 26 for 1 mM, n = 27 for 2 mM). (Middle) Zebrafish were untreated (n = 11) or treated with PTU (n = 5 for 1 mM, n = 10 for 2 mM, n = 3 for 3 mM). (Bottom) Zebrafish were untreated (n = 20) or treated with T4 (n = 6 for 10 nM, n = 5 for 20 nM, n = 9 for 30 nM). ∗∗p < 0.01, ∗∗∗∗p < 0.0001 compared with control.