
|
Fig. 6
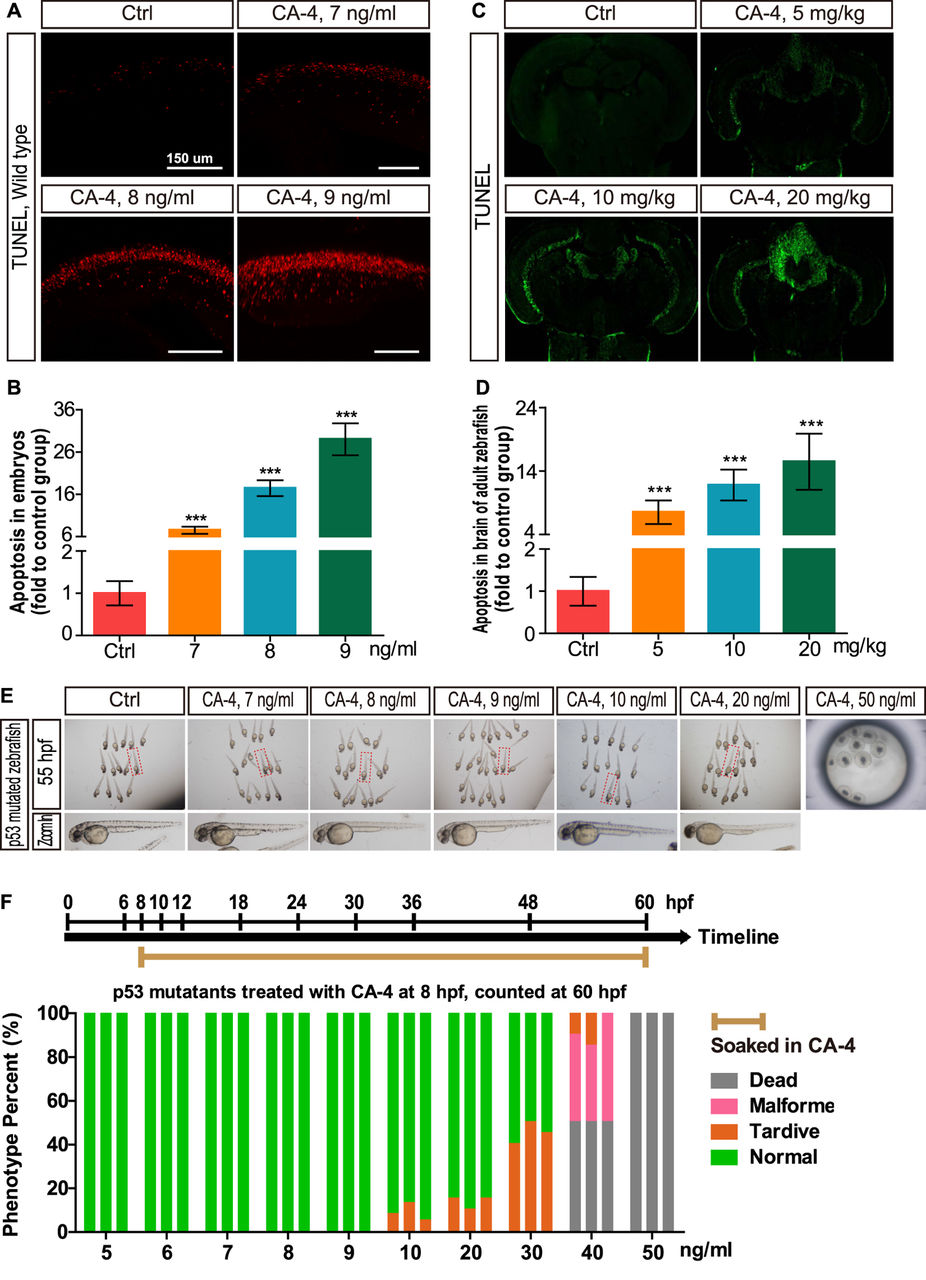
Cell apoptosis in central nervous system induced by CA-4 treatment.
(A,C) Cell apoptosis in spinal cord of zebrafish embryos and brain section stained with TUNEL reagent of adult zebrafish. (B,D) Statistical analyses of cell apoptosis in central nervous system of embryonic and adult zebrafish. Data were expressed as mean ± S.E.M. (n = 4). ***P < 0.001 vs. control group. (E) The bright field images of p53 mutated embryonic zebrafish in control group and 7, 8, 9 ng/ml CA-4 treated groups at 55 hpf. (F) Percentage of phenotype in p53 mutants induced by 5–50 ng/ml CA-4 treatment at 8 hpf, analyzed at 60 hpf. The experiments of CA-4 treatment at each concentration were repeated in triplicate. The percentage of Dead, Malformed, Tardive and Normal was displayed in Grey, Pink, Orange and Green columns, respectively.