
|
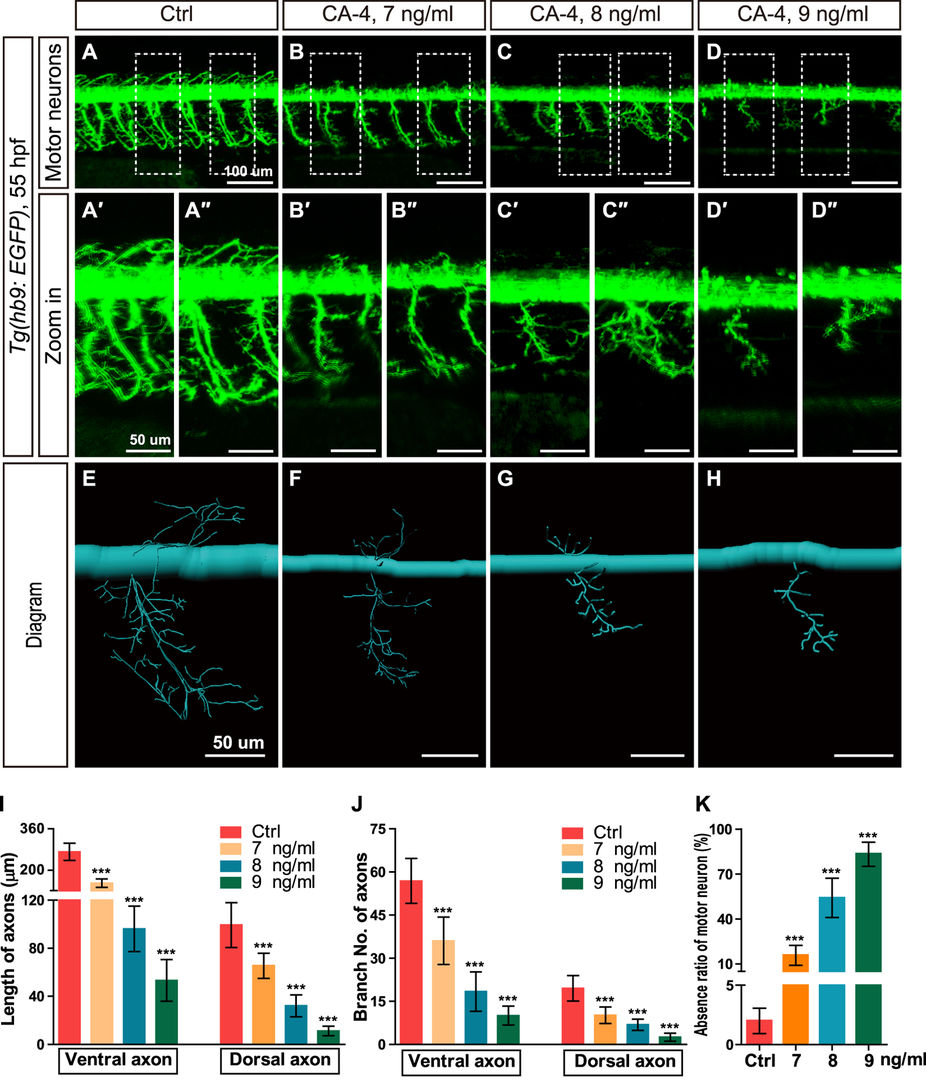
Fig. 5
Effects of CA-4 treatment on motor neurons in the Tg(hb9:EGFP) embryonic zebrafish at 55 hpf.
(A–D) Phenotype of motor neuron in control group and 7, 8, 9 ng/ml CA-4 treated groups at 55 hpf. Scale bar, 100 μm. (A′–D″) Zoomed in images of regions in dash line rectangles of panel A-D. Scale bar, 50 μm. (E–H) Diagrams of motor neurons. Scale bar, 50 μm. (I–K) Statistic analyses of the length and branch number of ventral and dorsal axons, as well as absence ratio of motor neurons in control group and 7, 8, 9 ng/ml CA-4 treated groups at 55 hpf. Data were expressed as the mean ± S.E.M. (n = 8). ***P < 0.001 vs. control group.