
|
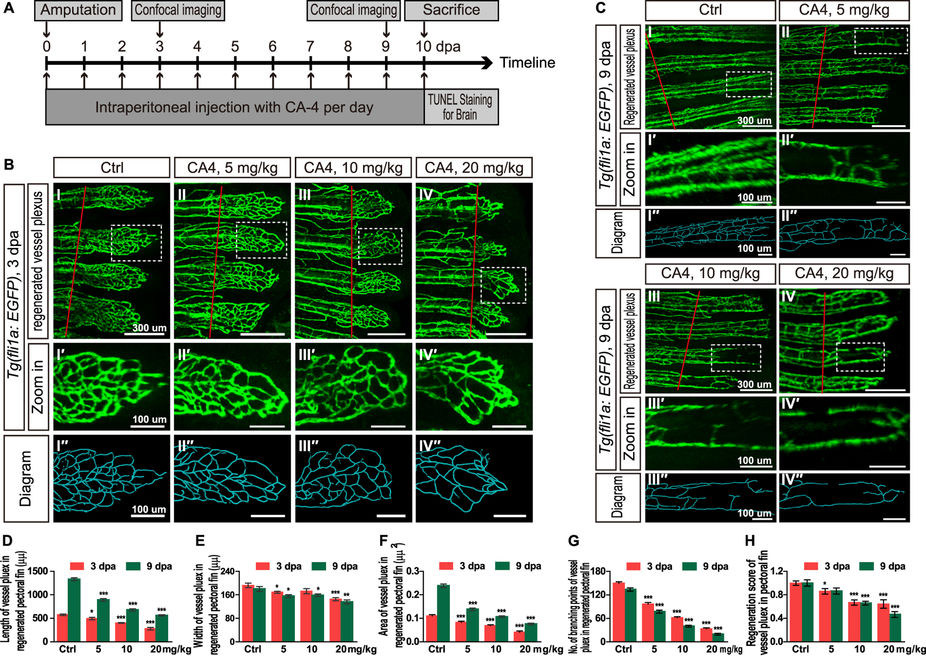
Fig. 4
Effects of CA-4 treatment on vessel plexus in regenerated pectoral of Tg(f li1a:EGFP) adult zebrafish at 3 dpa and 9 dpa.
(A) The design and pipeline of the experiments. (BI–IV) Vessel plexus in regenerated pectoral fin of control group and 5, 10, 20 mg/kg CA-4 treated groups at 3 dpa. Scale bar, 300 μm. The amputation sites were marked with red lines. (BI′–IV′) Zoomed in images of regions in dash line rectangles of panel B I–IV. Scale bar, 100 μm. (BI″–IV″) Diagrams of vessel plexus in regenerated pectoral fin generated with Imaris software. Scale bar, 100 μm. (CI–IV) Vessel plexus in regenerated pectoral fin of control group and 5, 10, 20 mg/kg CA-4 treated groups at 9 dpa. Scale bar, 300 μm. The amputation sites were marked with red lines. (CI′–IV′) Zoomed in images of regions in dash line rectangles of panel H-K. Scale bar, 100 μm. (CI′′–IV′′) Diagrams of vessel plexus in regenerated pectoral fin generated with Imaris software. Scale bar, 100 μm. (D–H) Statistical analyses of the length, width, area, branching points and regeneration score of vessel plexus in regenerated pectoral fin of control group and 5, 10, 20 mg/kg CA-4 treated groups at 3 and 9 dpa. Data were expressed as mean ± S.E.M. (n = 8). *P < 0.05, **P < 0.01 and ***P < 0.001 vs. control group.