
|
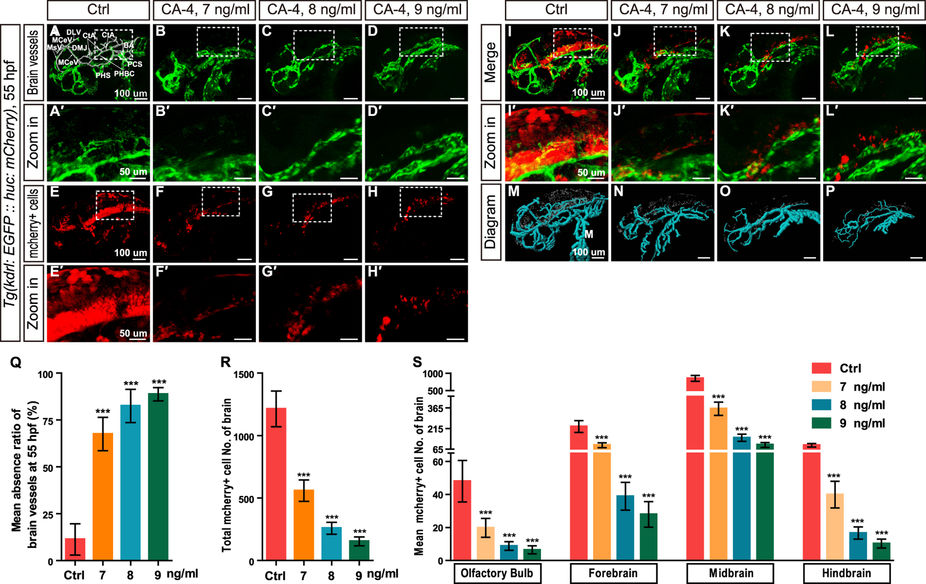
Fig. 3
Effects of CA-4 treatment on vascular and central nervous systems in the brain of Tg(kdrl:EGFP::huc:mcherry) embryonic zebrafish at 55 hpf.
(A–D) Phenotypes of brain vessel in control group and 7, 8, 9 ng/ml CA-4 treated groups. Scale bar, 100 μm. Brain vessels dorsal longitudinal vein (DLV), dorsal midline junction (DMJ), middle cerebral vein (MCeV), mesencephalic vein (MsV), central artery (CtA), basilar artery (BA), posterior communicating segment (PCS), primordial hindbrain channel (PHBC), and primary head sinus (PHS) were statistically analyzed. (A′–D′) Zoomed in images of regions in dash line rectangles of panel A–D. Scale bar, 50 μm. (E–H) mCherry positive cells in brain of control group and 7, 8, 9 ng/ml CA-4 treated groups. Scale bar, 100 μm. (E′–H′) Zoomed in images of regions in dash line rectangles of panel E-H. Scale bar, 50 μm. (I–L) Merged images of (A–H). Scale bar, 100 μm. (I′-L′) Zoomed in images of regions in dash line rectangles of panel I-L. Scale bar, 50 μm. (M–P) Diagrams of brain vessels and neuronal precursor cells. Scale bar, 100 μm. (Q–S) Statistical analyses of mean absence ratio of brain vessels, Number of neuronal precursor cell in brain, Olfactory bulb, forebrain, midbrain and hindbrain in control group and 7, 8, 9 ng/ml CA-4 treated groups. Data were expressed as the mean ± S.E.M. (n = 8). ***P < 0.001 vs. control group.