
|
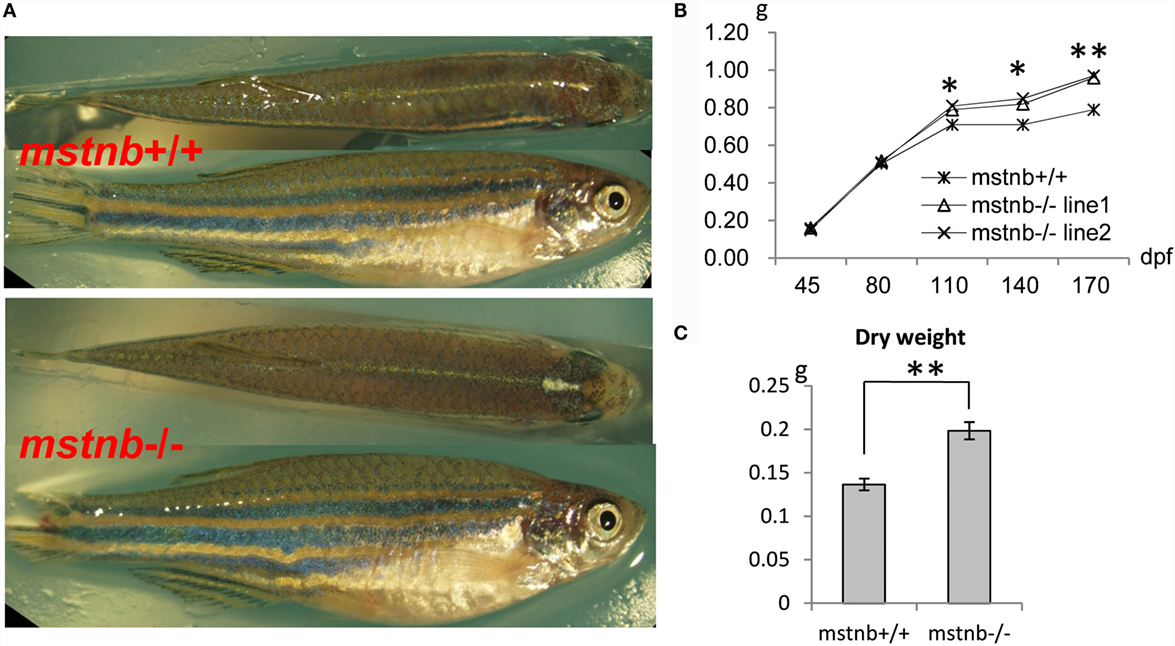
Fig. 2
General growth characterization of mstnb-deficient zebrafish. (A) Wild-type zebrafish (top panel) and mstnb-deficient zebrafish (bottom panel) both at 100 dpf. (B) Curves of the somatic growth of mstnb-deficient zebrafish and wild-type control from the juvenile stage to the adult stage. (C) Dry weight of mstnb−/− and wild-type zebrafish at 120 dpf stage. * and ** indicate significant differences at (P < 0.05) and very significant differences at (P < 0.01), respectively. Up to 55 individuals of mstnb-deficient zebrafish and 50 individuals of wild-type control were checked in the experiments and the data were consistent.