
Image
|
Figure Caption
Fig. S3
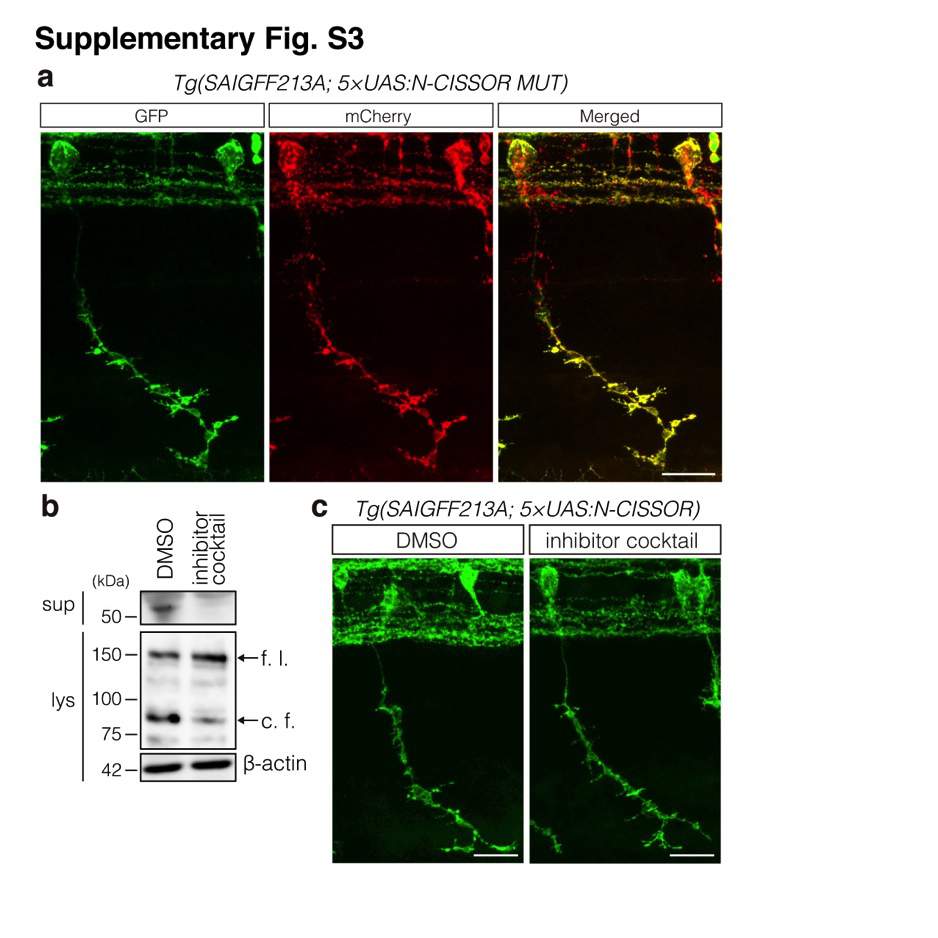
Inhibition of N-‐CISSOR cleavage in zebrafish embryos. (a) Representative image of Tg (SAIGFF213A; 5×UAS-‐N-‐CISSOR MUT) at 36 hpf. Scale bar: 10 μm. (b) Western blot analysis of the inhibition of N-‐CISSOR cleavage following treatment with an inhibitor cocktail (0.5 μM GM6001 and 0.1 μm BACE inhibitor IV; dissolved in DMSO) for 4 h. f. l.: full-‐length; c. f.: cleaved fragment. (c) GFP image of CaP neurons in Tg (SAIGFF213A; 5×UAS-‐N-‐CISSOR) treated with an inhibitor cocktail (0.5 mM GM6001 and 0.1 mM BACE inhibitor IV; dissolved in DMSO) obtained between 25 and 36 hpf. Scale bar: 20 μm
Acknowledgments
This image is the copyrighted work of the attributed author or publisher, and
ZFIN has permission only to display this image to its users.
Additional permissions should be obtained from the applicable author or publisher of the image.
Full text @ Sci. Rep.