
|
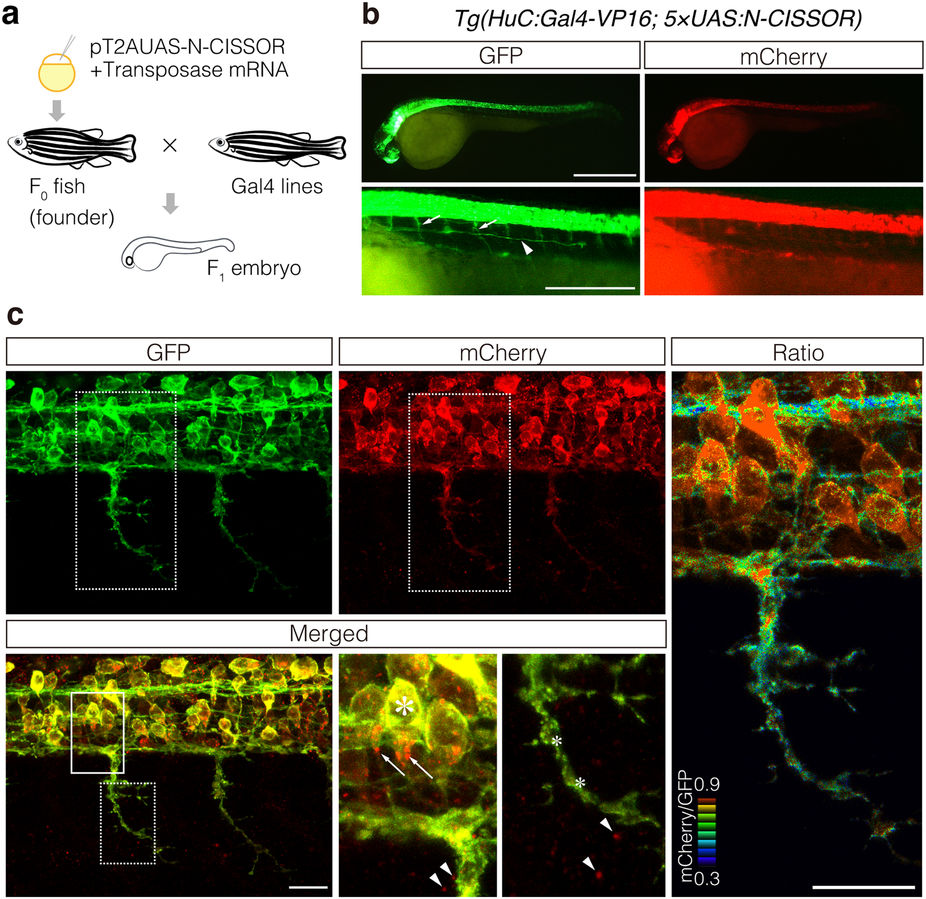
Fig. 4
Expression of N-CISSOR in zebrafish.
(a) Schematic representation of the procedure used for transgenesis and sample preparation. (b,c) Lateral view of the resulting F1 Tg (HuC:Gal4-VP16; 5 × UAS:N-CISSOR) embryo at 36 hpf under a fluorescence stereomicroscope (b) and a confocal microscope (c), showing N-CISSOR expression in the nervous system. (b) Spinal motor nerves and posterior lateral line are indicated by the arrows and arrowhead, respectively. Scale bar: 200 μm. (c) Maximum projection of z-stack images and views of magnified areas surrounded by solid and dotted borders are shown. High colocalization of GFP and mCherry in somas (large asterisk) and low colocalization in axons (small asterisks). Intracellular (arrows) and extracellular (arrowheads) accumulation of mCherry. The mCherry/GFP fluorescence ratio image is shown in the right column. Scale bar: 20 μm.