
Fig. 8
|
Fig. 8
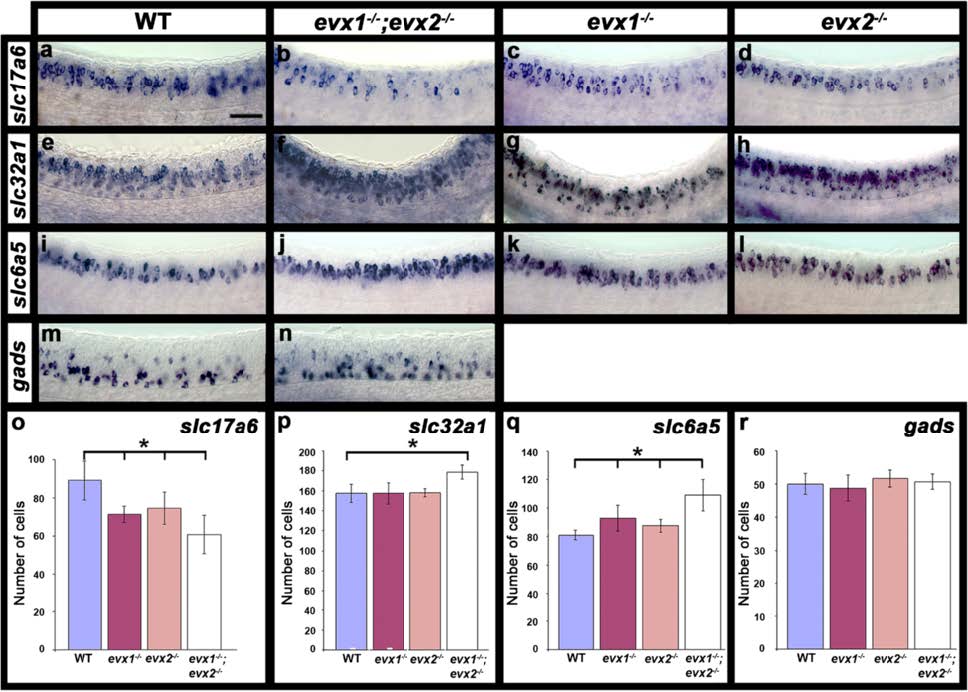
Neurotransmitter phenotypes in evx1;evx2 double mutant embryos. Lateral views of zebrafish spinal cord at 24 h (a-n). Anterior is left, dorsal up. in situ hybridization for gene or genes indicated. slc17a6 (a-d) corresponds to a mix of slc17a6b and slc17a6a probes that label glutamatergic cells; slc32a1 (e-h, formerly called viaat) labels all inhibitory cells; slc6a5 (i-l) labels glycinergic cells and gads (m & n) corresponds to a mix of gad1a and gad2 probes that labels GABAergic cells (see methods for more details). o-r Average number of cells (y-axis) expressing these markers (indicated in each case) in spinal cord region adjacent to somites 6-10 in WT embryos and evx1 and evx2 single and double mutants (x-axis) at 24 h. Values are shown as mean +/- standard deviation (values are provided in Table 1). In each case at least 5 embryos were counted. Statistically significant differences (P < 0.05) from WT values are indicated with brackets and stars. P values for all comparisons are provided in Table 1. Scale bar: 50 μm (a-n)