
|
Fig. 3
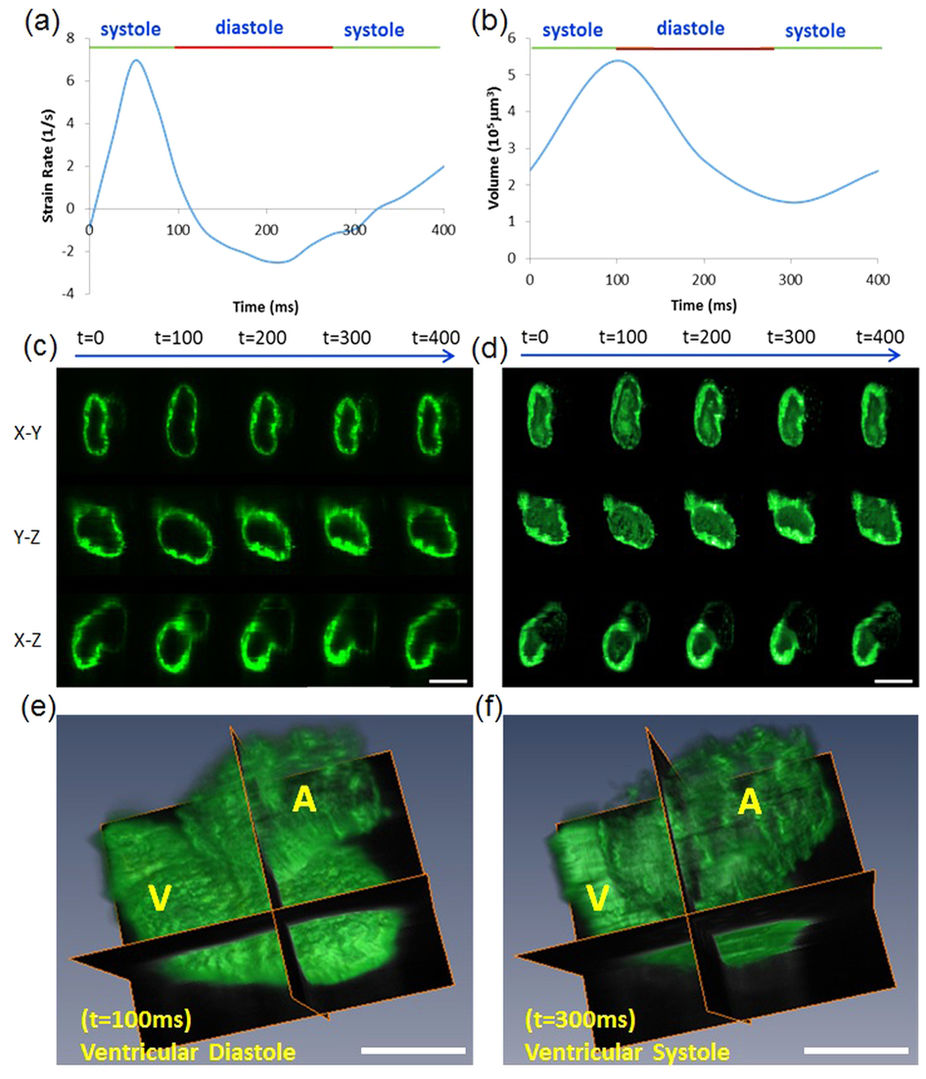
4-D synchronized images to quantify global longitudinal strain rates and volume change of the ventricle at 100 hours post fertilization (hpf).
(a) Changes in global longitudinal strain rates were quantified during the entire cardiac cycle. (b) The ventricular volume was measured in terms of EDV at 95.4 × 105 μm3 and ESV at 1.5 × 105 μm3, respectively. (c) LSFM images captured the zebrafish hearts in the x-y, x-z, and y-z planes during the cardiac cycle. (d) 4-D synchronized LSFM-acquired images revealed endocardial trabeculation in the x-y, x-z and y-z plane during the cardiac cycle. (e,f) 4-D zebrafish cardiac motion was captured during ventricular diastole and systole. A: Atrium, V: Ventricle. Scale bar: 50 μm