
Image
|
Figure Caption
Fig. S1
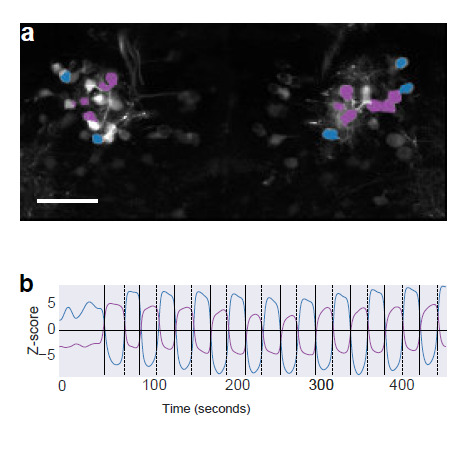
Response of pretectal tph2 neurons to light and darkness.
(a) Dorsal view of the pre-tectal area of a 11 dpf Tg(tph2:GAL4, UAS:GCaMP6s) fish, with anterior at the top. The purple colour indicates cells that are excited by light (ON cells), whereas the blue colour indicates cells that are excited by darkness (OFF cells). (b) Response of pretectal tph2 neurons to light and darkness, determined using k-means clustering of a time-series recorded at 1 Hz. The series was analysed using the Thunder platform. Scale bar = 25 μm.
Acknowledgments
This image is the copyrighted work of the attributed author or publisher, and
ZFIN has permission only to display this image to its users.
Additional permissions should be obtained from the applicable author or publisher of the image.
Full text @ Sci. Rep.